
Figure 1. Loss of WRNIP1 leads to nascent DNA strand degradation after HU‐induced replication stress.
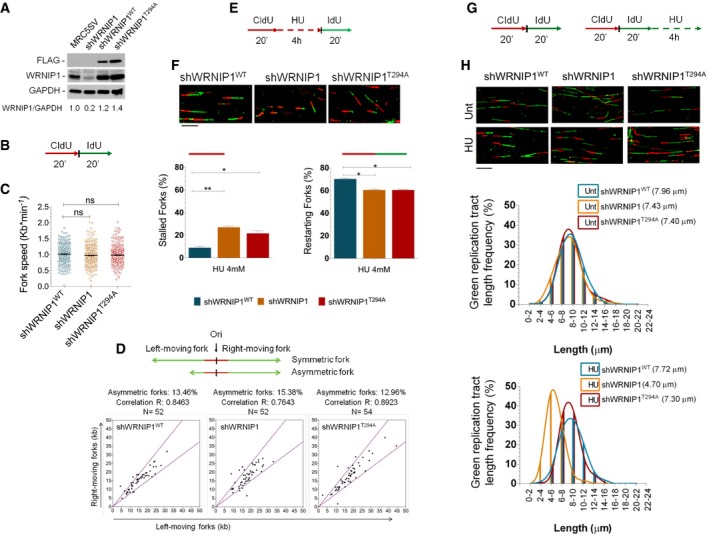
- Western blot analysis showing the expression of the WRNIP1 protein in wild‐type cells (shWRNIP1WT) and WRNIP1‐deficient (shWRNIP1) or mutant (shWRNIP1T294A) cells. MRC5SV fibroblasts were used as a positive control. The membrane was probed with an anti‐FLAG or anti‐WRNIP1. GAPDH was used as a loading control. Below each lane of the blot the ratio of WRNIP1 protein to total protein, then normalized to MRC5SV, is reported.
- Experimental scheme of dual labelling of DNA fibres in shWRNIP1WT, shWRNIP1 and shWRNIP1T294A cells. Cells were pulse‐labelled with CldU and then subjected to a pulse‐labelling with IdU.
- Analysis of replication fork velocity (fork speed) in the cells under unperturbed conditions. The length of the green tracks was measured. Mean values are represented as horizontal black lines (ns, not significant; Student's t‐test).
- Cells were treated as in (B). For each replication origin, the length of the right‐fork signal was measured and plotted against the length of the left‐fork signal. A schematic representation of symmetric and asymmetric forks is given. If the ratio between the left‐fork length and the right‐fork length deviated by more than 33% from 1 (that is, outside the violet dashed lines in the graphs), the fork was considered asymmetric. The percentage of asymmetric forks was calculated for all cell lines. N = number of forks counted for each cell line. R represents linear correlation coefficient.
- Experimental scheme of dual labelling of DNA fibres in shWRNIP1WT, shWRNIP1 and shWRNIP1T294A cells. Cells were pulse‐labelled with CldU, treated with 4 mM HU and then subjected to a pulse‐labelling with IdU.
- Graphs show the percentage of red (CldU) tracts (stalled forks) or red‐green (CldU‐IdU) contiguous tracts (restarting forks) in the cells. Means are shown, n = 3. Error bars represent standard error (*P < 0.05; **P < 0.01; Student's t‐test). Representative DNA fibre images are shown. Scale bar, 10 μm.
- Experimental scheme of dual labelling of DNA fibres in shWRNIP1WT, shWRNIP1 and shWRNIP1T294A cells. Cells were sequentially pulse‐labelled with CldU and IdU as indicated, then treated or not with 4 mM HU.
- Representative IdU tract length distributions in all cell lines under unperturbed conditions (top graph) or after HU treatment (bottom graph). Median tract lengths are given in parentheses. See also Appendix Tables S1 and S2 for details on the data sets and statistical test. Representative DNA fibre images are shown. Scale bar, 10 μm.
Source data are available online for this figure.