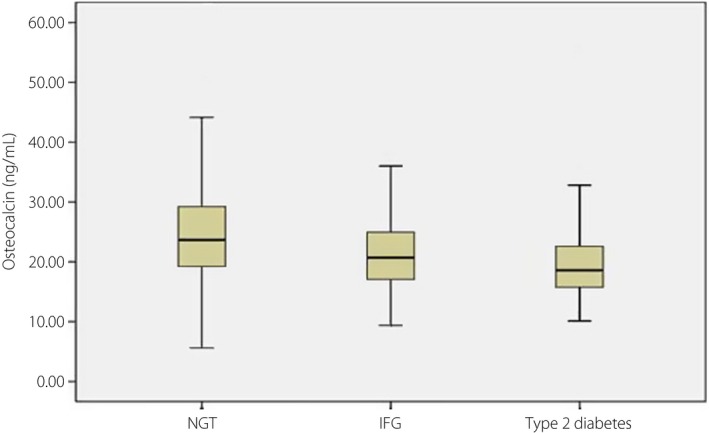
Figure 1.

Distribution of serum osteocalcin level in subjects with normal glucose tolerance (NGT), impaired fasting glucose (IFG) and type 2 diabetes mellitus in the cross‐sectional study. The bars represented median, 25th, and 75th percentile of serum osteocalcin level. P for trend <0.001.
