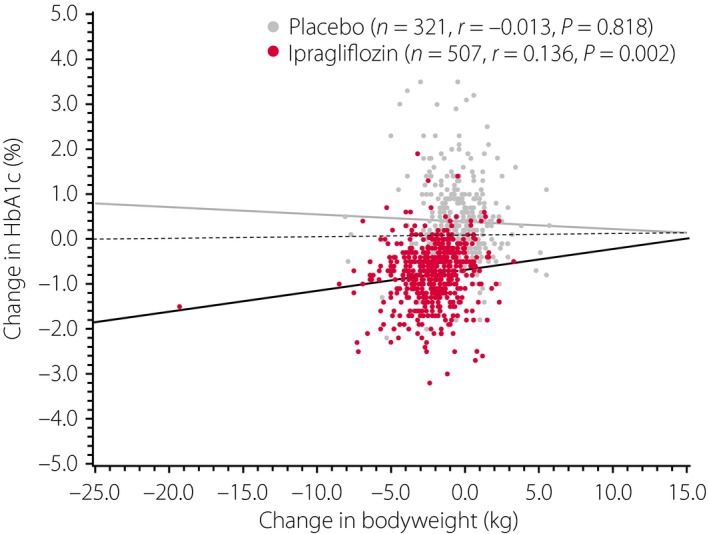
Figure 3.

Scatter plots for the relationship between the changes in bodyweight and hemoglobin A1c from baseline to the end of treatment in the placebo (n = 321, r = −0.013, P = 0.818) and ipragliflozin (n = 507, r = 0.136, P = 0.002) groups. HbA1c, hemoglobin A1c.
