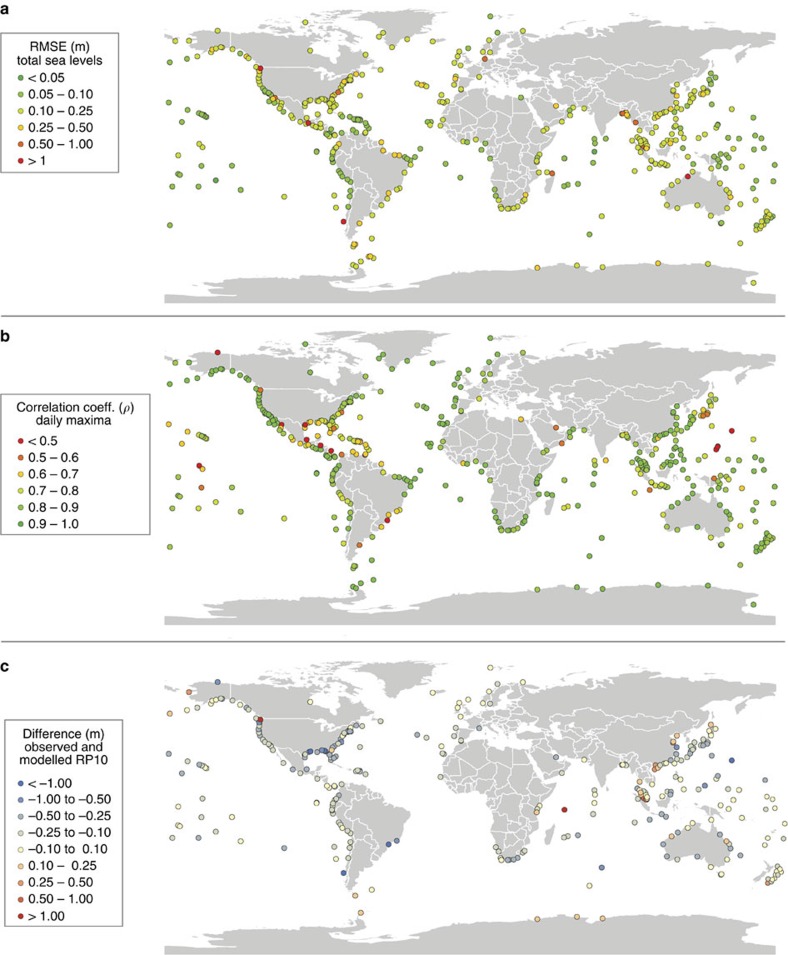
Figure 1. Maps showing the performance of GTSR against observed sea levels.
The performance of GTSR shown as (a) the RMSE (m) between modelled and observed sea level time series; (b) the Pearson correlation coefficient (ρ) between modelled and observed daily maximum sea levels; and (c) the bias (m) calculated by subtracting the modelled extreme sea levels from the observed extreme sea levels with a return period of 10 years.

