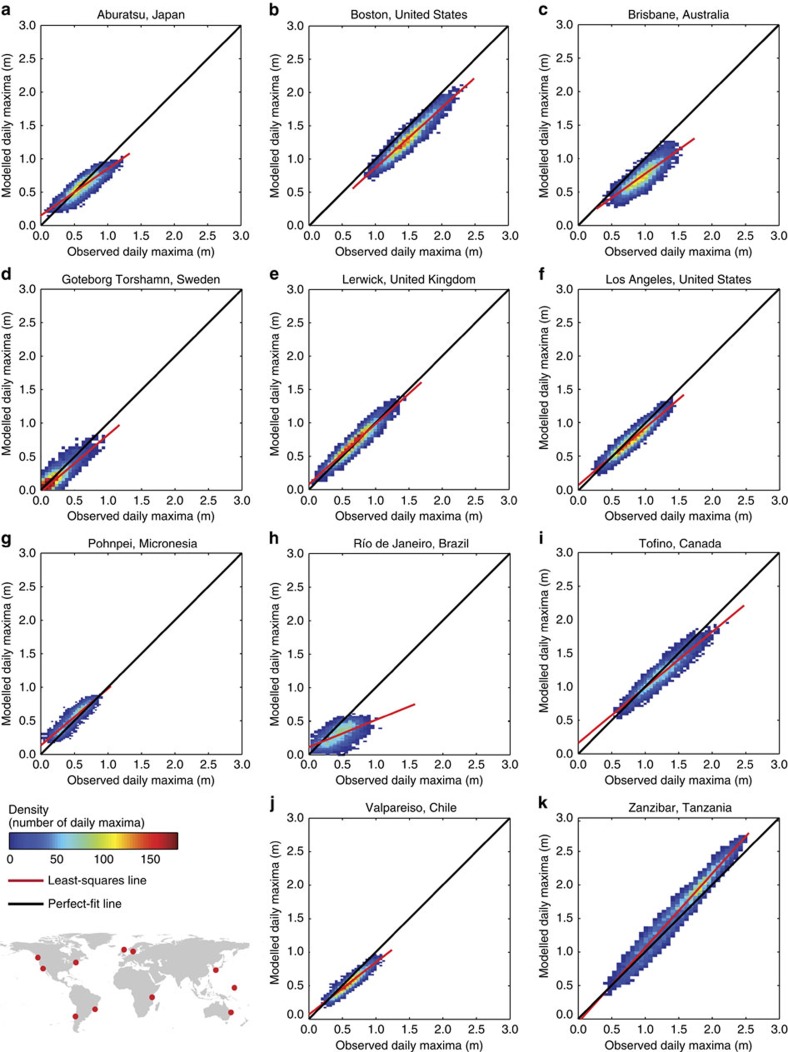
Figure 3. Scatter plots of modelled and observed daily maxima at selected stations.
Scatter plots for (a) Abaratsu, Japan; (b) Boston, United States; (c) Brisbane, Australia; (d) Goteborg-Torshamn, Sweden; (e) Lerwick, United Kingdom; (f) Los Angeles, United States; (g) Pohnpei, Micronesia; (h) Río de Janeiro, Brazil; (i) Tofino, Canda; (j) Valpareiso, Chile; and (k) Zanzibar, Tanzania. Colours indicate the data density for bins with a 5 cm × 5 cm size. The red dots in the world map indicate the location of the observations stations.

