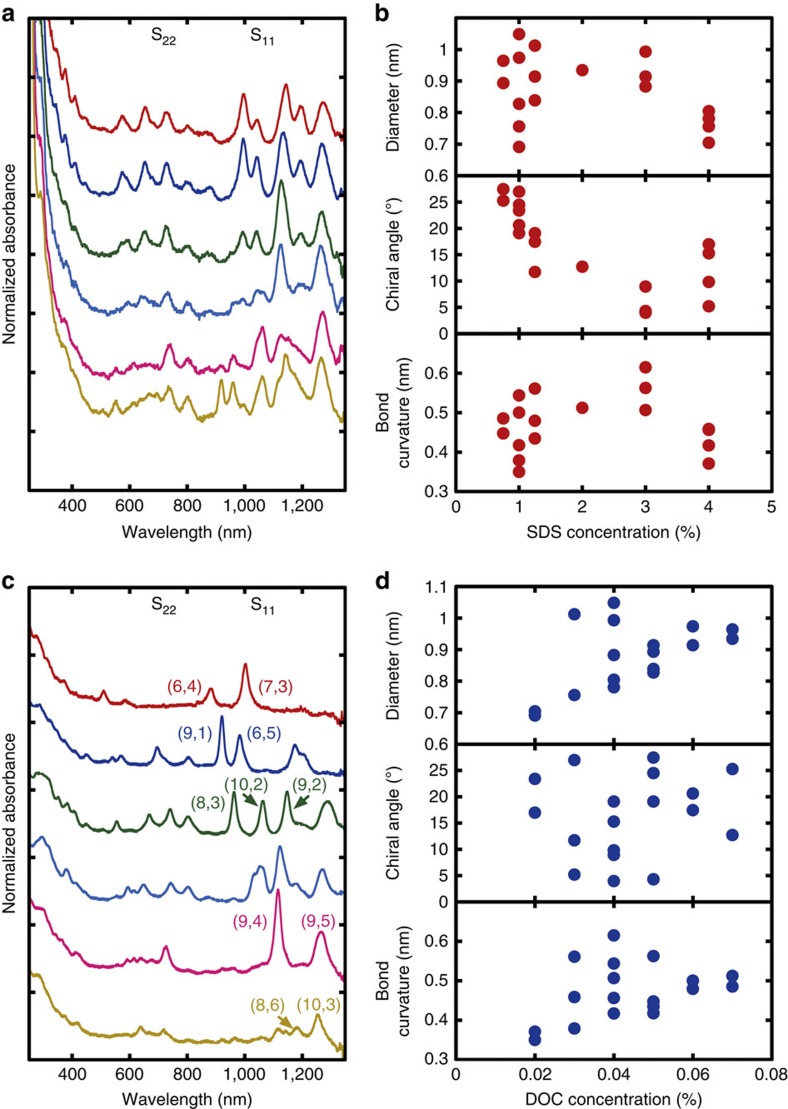
Figure 1. Chirality separation in a mixed-surfactant system.
(a,c) Optical absorption spectra of the eluted SWCNTs at different SDS concentrations in the SC/SDS system (a) and at different DOC concentrations in the SC/SDS/DOC system (c). These spectra correspond to following surfactant concentrations in order from top to bottom. (a) SDS concentrations of 0.75, 1.00, 1.25, 2.00, 3.00 and 4.00%. (c) DOC concentrations of 0.02 0.03, 0.04, 0.05, 0.06 and 0.07%. These spectra are normalized at 280 nm and vertically shifted for comparison. (b,d) The relationship between the elution order of chirality species and their physical properties, including diameter (top of panel), chiral angle (middle of panel) and smallest bond curvature radius (bottom of panel), in the SC/SDS system (b) and the SC/SDS/DOC system (d). The surfactant concentration for each chirality species was estimated from that of the fraction which shows the brightest Photoluminescence peak for each species. The detailed order of each (n,m) species in each system is shown in Supplementary Fig. 3.

