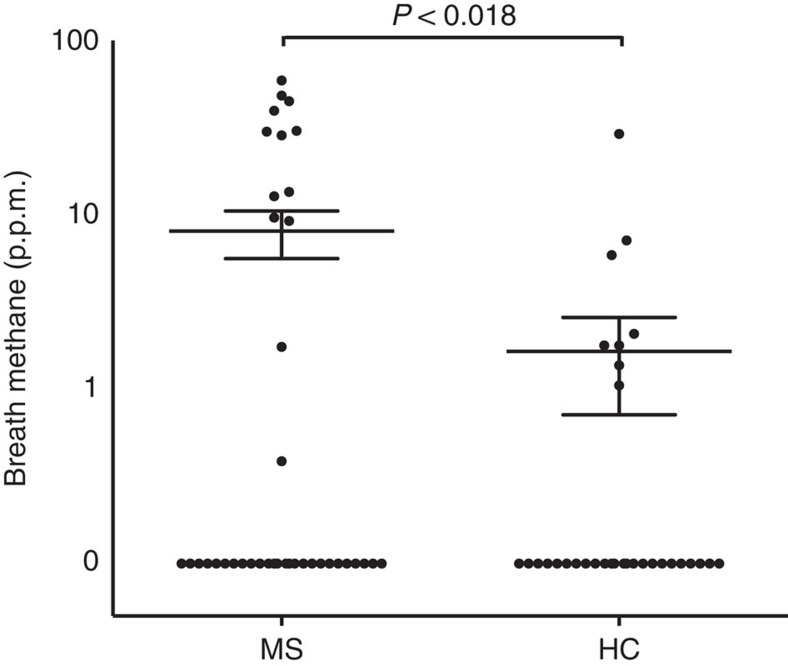
Figure 4. Measurement of breath methane production in MS patients (n=41) and controls (n=32).
Breath methane measured in each subject is represented on the y axis in parts-per-million on a logarithmic scale. The mean and s.e.m. are shown by the indicated horizontal lines. 28 of 41 MS patients and 24 of 32 controls had no detectable breath methane.

