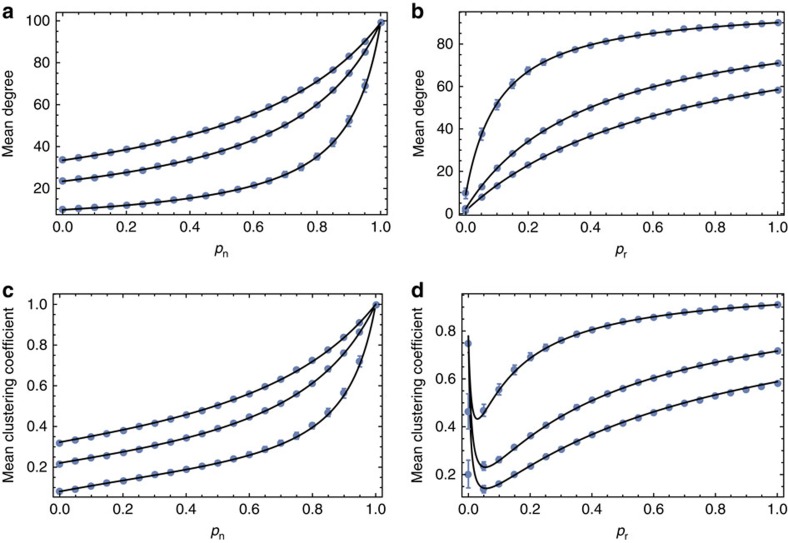
Figure 2. Mean degree and clustering coefficient as a function of model parameters.
The dependency of mean degree (a,b) and clustering coefficient (c,d) on social inheritance, pn (a,c), and probability of random bonding, pr (b,d). In each panel, the black curves depict our analytical approximation while the blue dots with error bars are mean and s.d. of 50 replicate runs. For the two panels on the left, the curves correspond to, from top to bottom, pr=0.5, 0.3 and 0.1; for the two panels on the right, from top to bottom, pn=0.9, 0.6 and 0.3. For all panels, network size N=100; the simulations were initiated with random networks and run for 2,000 time steps.

