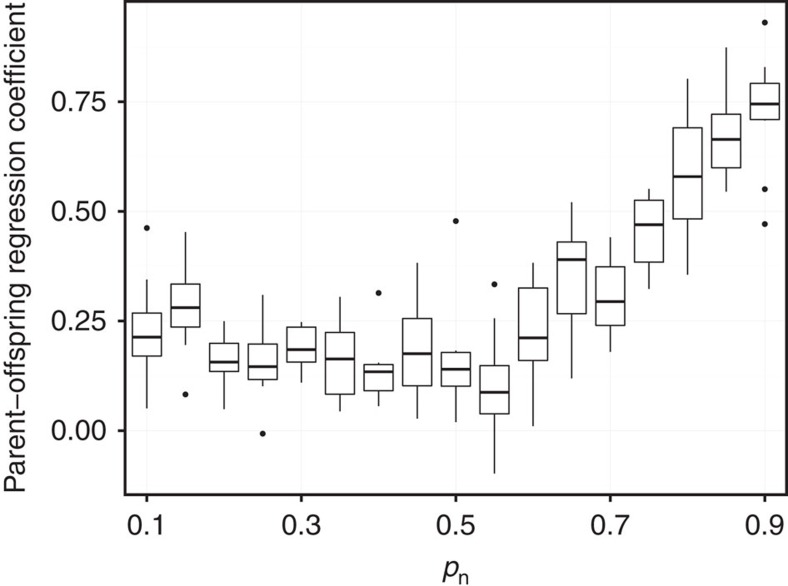
Figure 4. Heritability as a consequence of social inheritance.
The regression of betweenness centrality among parents and their offspring as a function of the strength of social inheritance (pn). The bottom and top of the box mark the first and third quartiles, respectively. The upper whisker extends from the hinge to the highest value that is within 1.5 × IQR of the hinge, where IQR is the inter-quartile range, or distance between the first and third quartiles. The lower whisker extends from the hinge to the lowest value within 1.5 × IQR of the hinge. Data beyond the end of the whiskers are outliers and plotted as points. Ten replications were run for each pn value. Parameter values: simulation steps=2,000, N=100, pr=0.01.

