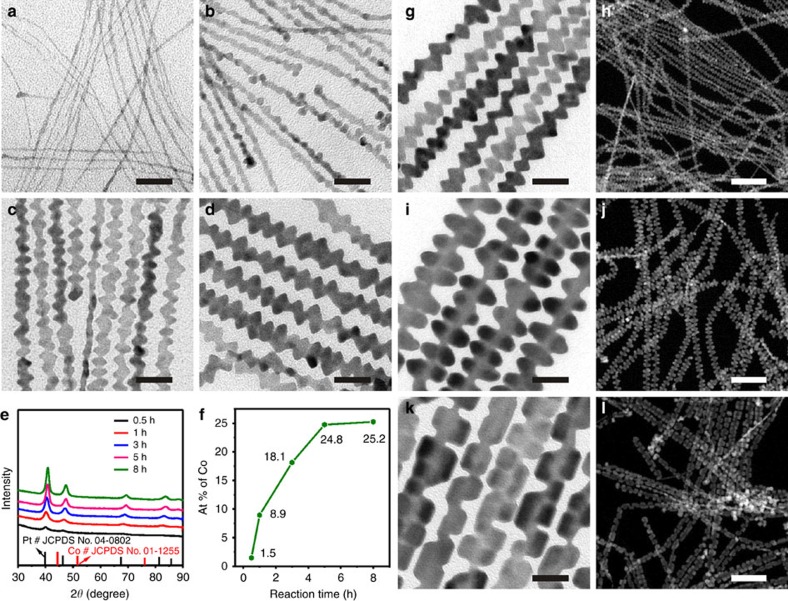
Figure 3. Growth mechanism and structural tuning.
Typical TEM images of hierarchical Pt3Co NWs intermediates collected from (a) 0.5, (b) 1, (c) 3 and (d) 5 h. (e) PXRD patterns of hierarchical Pt3Co NWs intermediates collected from the reactions at different reaction times. (f) The composition ratio changes of Co to Pt for the hierarchical Pt3Co NWs intermediates, as determined by ICP-AES measurements. Typical TEM images and HAADF-STEM images of (g–h) hierarchical Pt3Co NWs, (i,j) hierarchical Pt7Co NWs and (k,l) hierarchical Pt10Co NWs collected from 8 h reactions. The scale bars in a–d, g, i and k are 20 nm. The scale bars in h,j and l are 100 nm.

