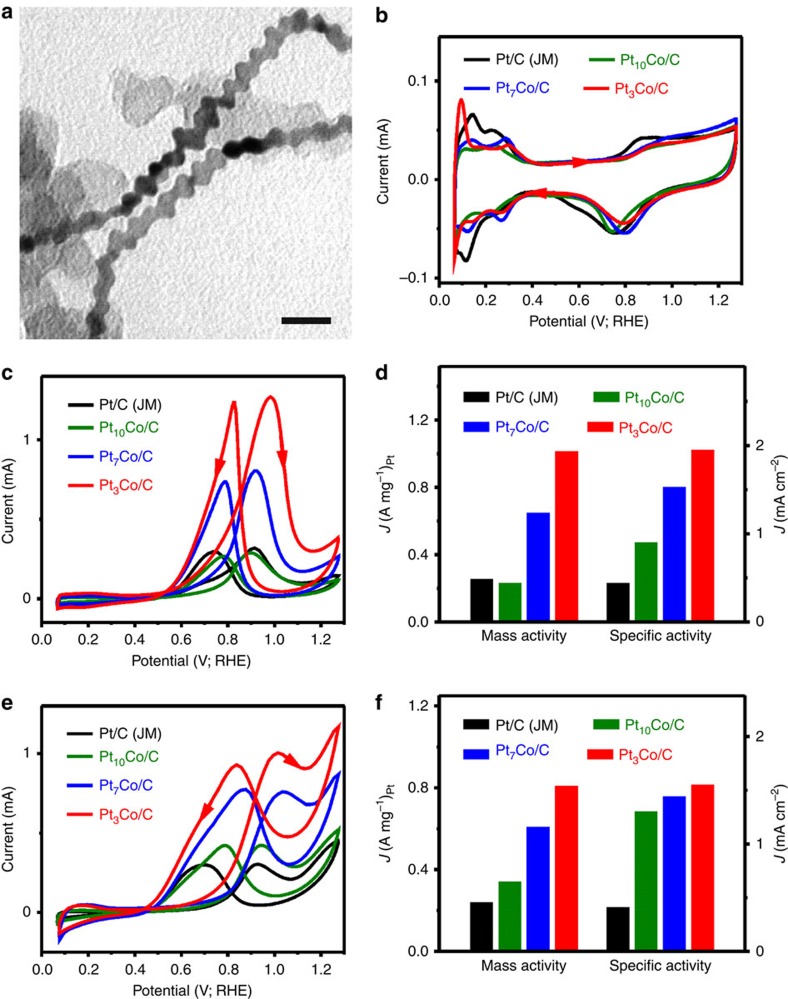
Figure 4. Alcohol electro-oxidation performance comparison.
(a) Representative TEM image and (b) CVs of different catalysts in 0.1 M HClO4 solution. (c) CVs and (d) histogram of mass and specific activities of different catalysts for MOR in 0.1 M HClO4+0.2 M methanol solution. (e) CVs and (f) histogram of mass and specific activities of different catalysts for EOR in 0.1 M HClO4+0.2 M ethanol solution. The scale bar in a is 20 nm.

