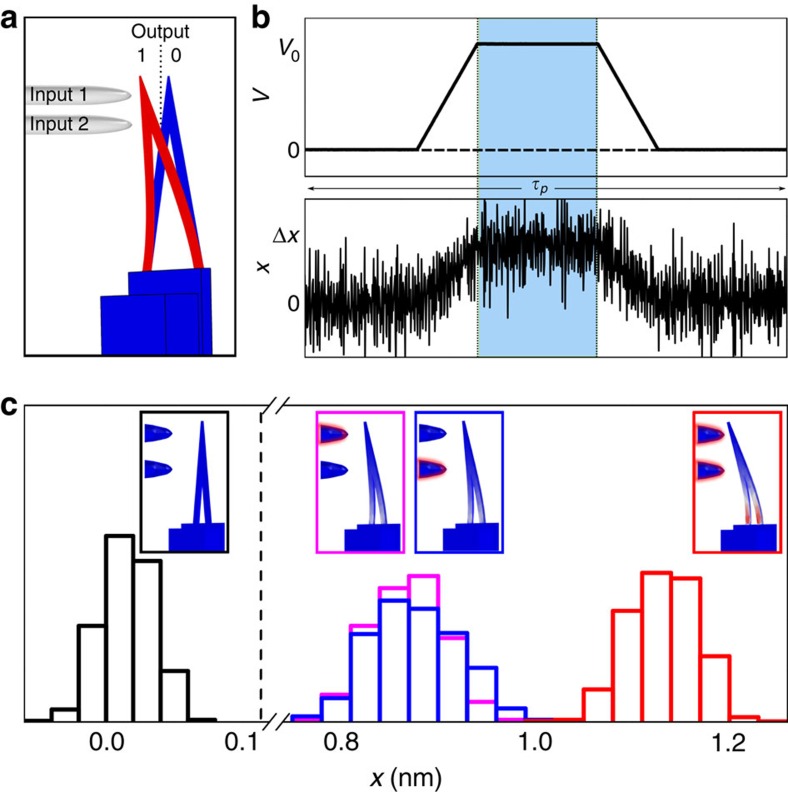
Figure 2. Schematic of the logic gate operation mode.
(a) Inputs are the forces acting on the cantilever through the electrodes. The position of the cantilever tip encodes the output of the logic gate. (b) Value of the electrode voltage V (logic input) and the consequent displacement of the cantilever tip x (gate output). (c) Statistical distribution of the cantilever tip position as a function of the four possible inputs (that is, 00, 01, 10 and 11); the threshold value for the OR gate is represented by the dashed line. By changing the position of the dashed line, the gate can be operated also as an AND gate.

