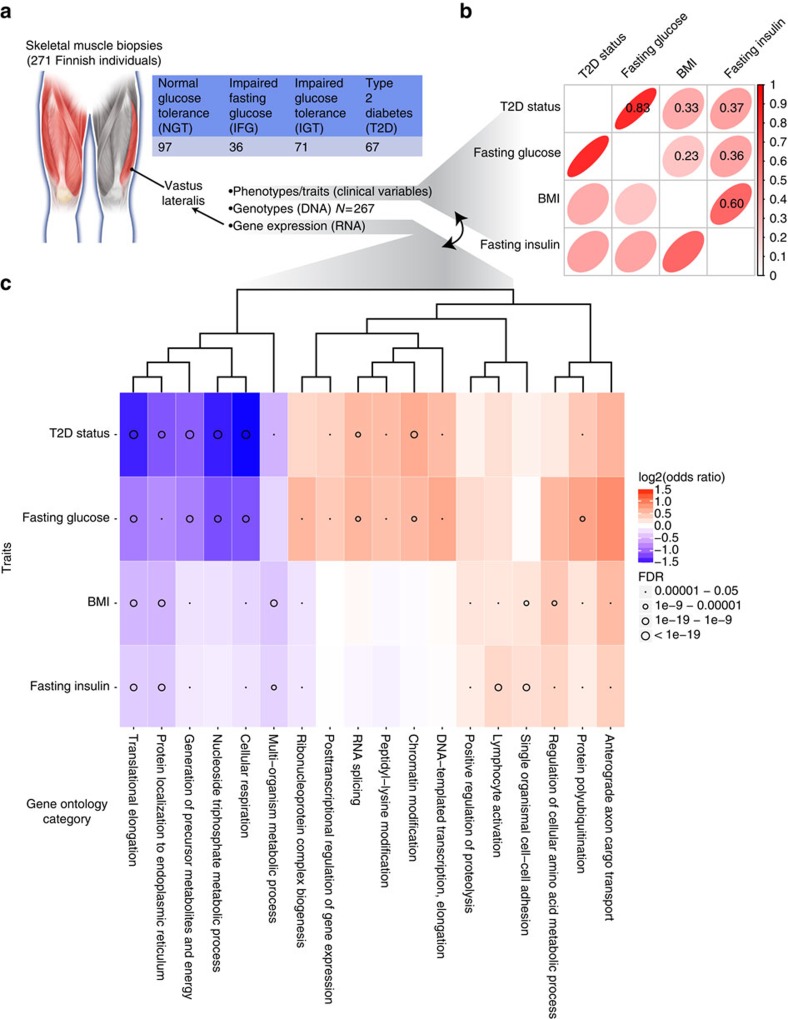
Figure 1. Molecular profiling maps of skeletal muscle combined with dense phenotyping reveals insights about T2D.
(a) To understand the full spectrum of genetic variation and regulatory element usage in T2D-relevant tissue and across disease progression, we obtained skeletal muscle biopsies from the vastus lateralis of 271 well-phenotyped Finnish individuals with normal and impaired glucose tolerance, impaired fasting glucose or newly diagnosed, untreated T2D. (b) Correlogram of Spearman rank correlation coefficients for key metabolic traits. (c) Heatmap of GO terms for differentially expressed genes. For each trait, the 20 GO terms most significantly enriched for positive expression–trait association and the 20 GO terms most significantly enriched for negative expression–trait association were selected. GO terms were pruned to eliminate redundant terms. The terms were hierarchically clustered using the GO term enrichment beta. Darker red, stronger positive gene expression–trait association; darker blue, stronger negative association. Circle size represents number of significant GO terms.

