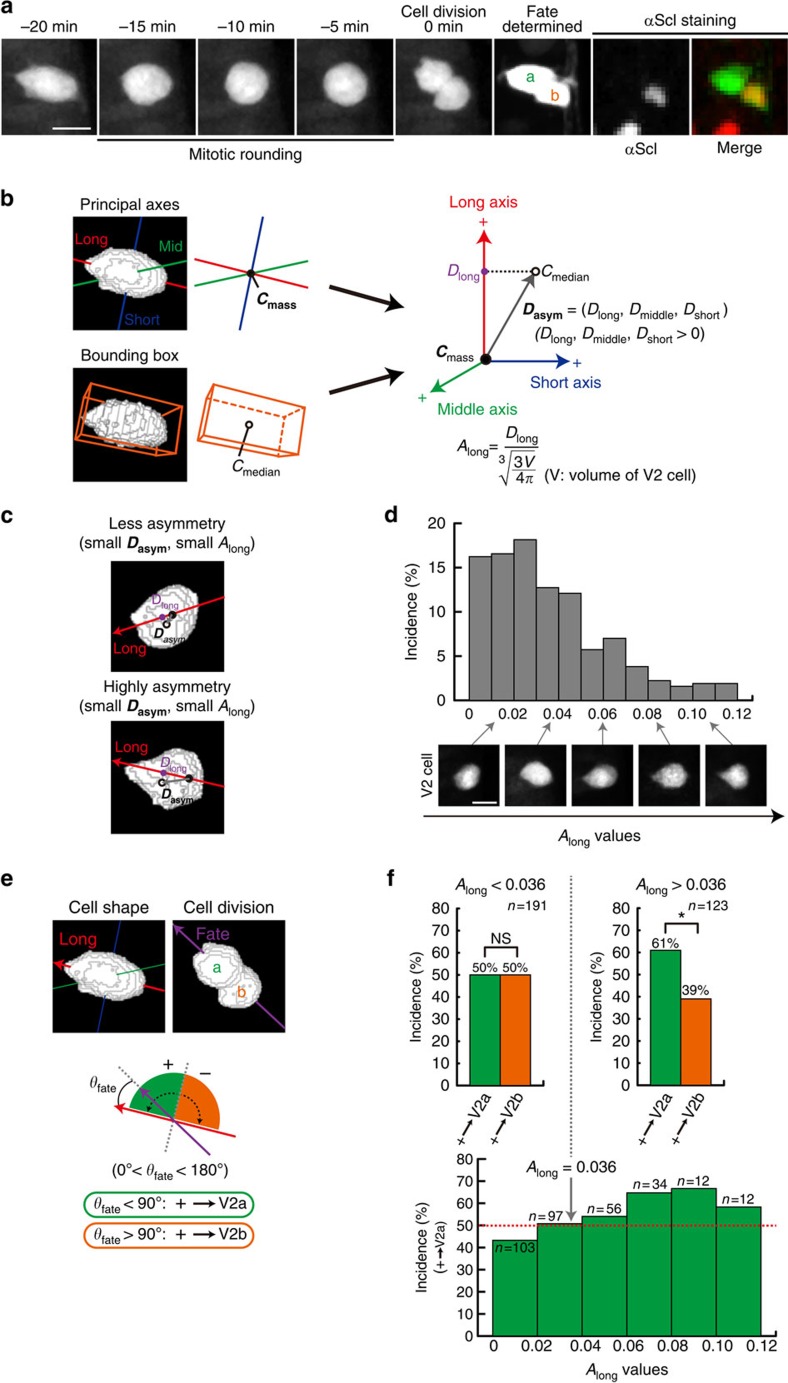
Figure 1. Quantitative definition of cellular eccentricity of V2 cells and its relation to their fates.
(a) Dynamics of shape changes of V2 cell. (b) Quantitative representation of the direction and degree of the asymmetric elongation of V2 cell shape. (c) Typical examples of less (top) and highly (bottom) asymmetric cell shapes in 3D. (d) The distribution of various Along values of all V2 cells (n=314) analysed in this study. See also Supplementary Fig. 1 and Supplementary Movies 1 and 2. (e) Orientating (+ or −) the positions of the two daughter cells (V2a and V2b) by fate axis. (f) Bias in the stochastic fate decision-making according to Along values. Receiver-operating characteristic analysis found the threshold for the shape-fate relation is Along=0.036. Red dotted line indicates 50% incidence. Scale bar, 10 μm. NS, not significant. *P<0.05 (χ2-test).

