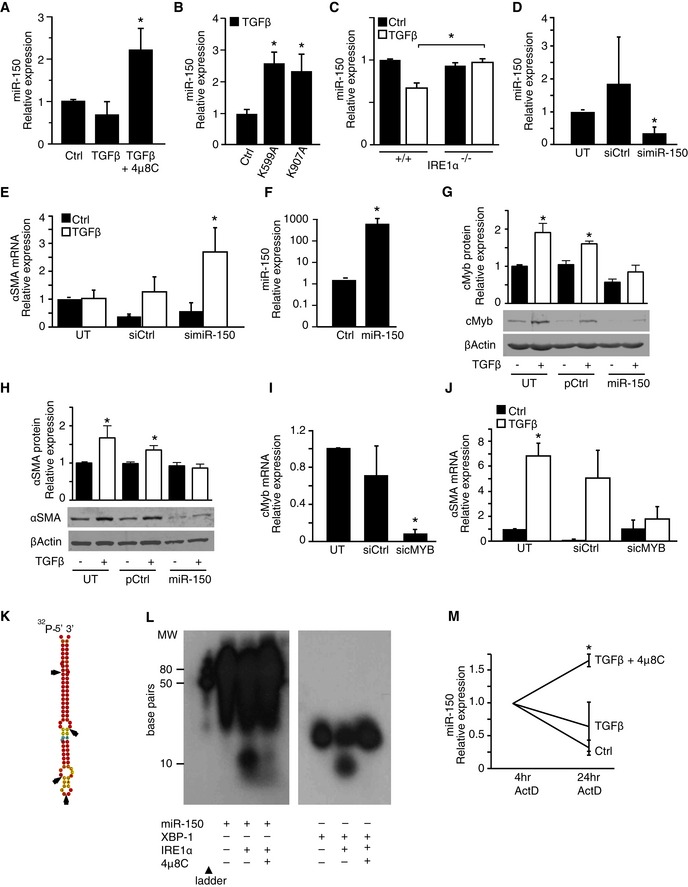
miR‐150 levels in TGFβ‐treated HFL1 fibroblasts and the effect of the IRE1α inhibitor 4μ8C. *P = 0.046 compared to control.
miR‐150 levels in HFL1 fibroblasts overexpressing two RNase‐dead mutants (K599A and K907A) of IRE1α. *P = 0.0043 (K599A), P = 0.043 (K907A), compared to control.
miR‐150 levels in TGFβ‐treated WT (IRE1α +/+) and IRE1α −/−
MEF cells. *P = 0.018. Results are expressed as fold change compared to the Ctrl.
miR‐150 levels in IRE1α −/−
MEF cells that were either untransfected (UT) or transfected with miRNA inhibitor control (siCtrl) or with a miR‐150‐5p miRNA inhibitor. *P = 0.034 compared to UT.
αSMA mRNA expression in TGFβ‐treated IRE1α −/−
MEF cells that were either untransfected (UT) or transfected with miRNA inhibitor control (siCtrl) or with a miR‐150‐5p miRNA inhibitor. *P = 0.043 compared to UT.
miR‐150 levels in HFL1 fibroblasts transfected with a control plasmid (Ctrl) or a miR‐150 expression plasmid (miR‐150). *P = 0.038.
Western blot of c‐Myb in TGFβ‐treated HFL1 fibroblasts that were either untransfected (UT), transfected with a control plasmid (pCtrl) or a miR‐150 expression plasmid (miR‐150). *P = 0.0206 in UT Ctrl versus UT TGFβ and P = 0.0126 in pCtrl Ctrl versus pCtrl TGFβ.
Western blot of αSMA in the same experimental setup as in (G). *P = 0.0405 in UT Ctrl versus UT TGFβ, and P = 0.0284 in pCtrl Ctrl versus pCtrl TGFβ.
c‐Myb mRNA levels in untransfected HFL1 cells (UT) and in cells transfected with a control siRNA (siCtrl) or an siRNA targeting c‐Myb (sicMyb). *P = 0.00001 compared to UT.
αSMA mRNA expression in untransfected HFL1 cells (UT) and in cells transfected with a control siRNA (siCtrl) or with a siRNA targeting c‐Myb (sicMyb). *P = 0.0042 in UT Ctrl versus UT TGFβ.
Putative IRE1α cleavage sites in miR‐150 based on sequence analysis are indicated with arrows.
In vitro cleavage assay with recombinant IRE1α and miR‐150 (left) or XBP‐1 (right).
miR‐150 expression in HFL‐1 cells that were pre‐treated with TGFβ in the absence of presence of 4μ8C and then treated with actinomycin D (ActD) for 4 and 24 h. *P = 0.027 compared to TGFβ.
‐test. Significant differences are indicated with * and exact
‐values given. Error bars indicate s.e.m.
= 4 in (F).