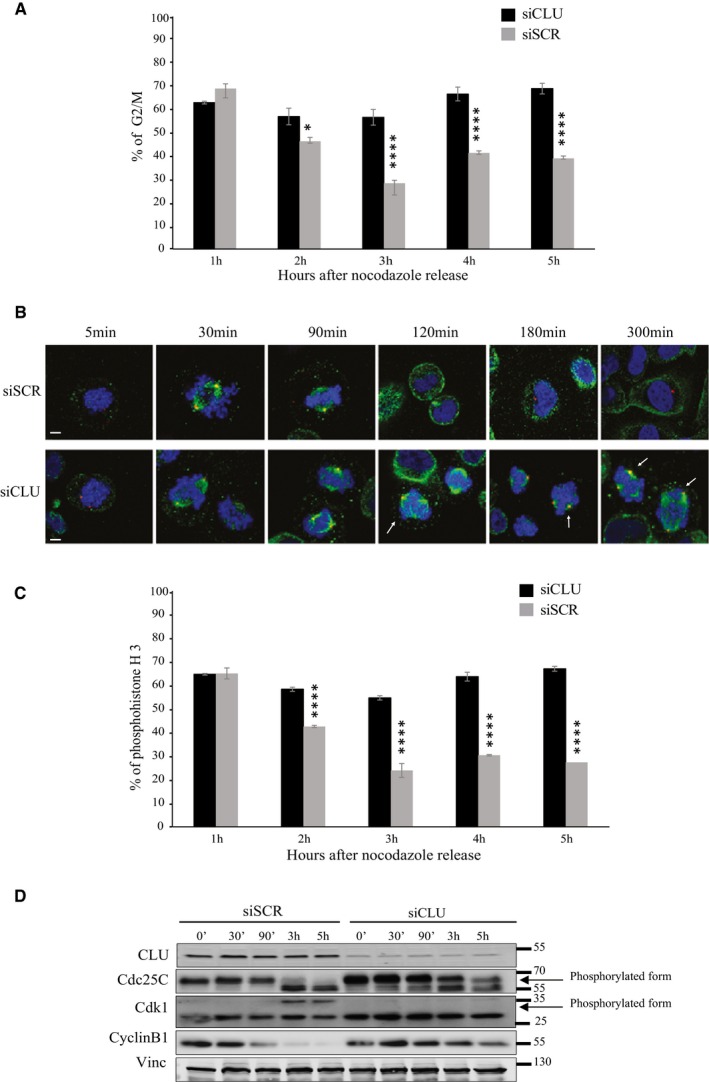
Figure 5. Knockdown of CLU leads to delay in the exit from mitosis.

- Flow cytometry for PC3 cells after transfection with siSCR or siCLU and synchronization to the M phase with thymidine/nocodazole block. DNA content was analyzed at the indicated time point after nocodazole release. Histograms show % of cells in G2/M, over 5 h period. Error bars represent mean ± SEM, n = 3, *P < 0.05, ****P < 0.0001 by ANOVA followed by Bonferroni's post hoc correction. (2 h P = 0.0142).
- Immunofluorescence in PC3 cells after siSCR or siCLU transfection, synchronization and nocodazole release at indicated time points. Mitotic spindle formation was assessed by confocal microscopy, using pericentrin (centrioles; red) and β‐tubulin (microtubules; green) antibodies. DNA was counterstained with (DAPI) (blue). White arrows represent segregation abnormalities. Scale bar represents 10 μm.
- Flow cytometry to assess phosphohistone H3 levels in the same setting as in (A). Error bar represents mean ± SEM, n = 3, ****P < 0.0001 by ANOVA followed by Bonferroni's post hoc correction.
- Western blot for CLU, Cdc25C, Cdk1, and cyclin B1 antibodies in PC3 cells after transfection with siSCR or siCLU, synchronization and nocodazole release at the indicated time. Vinculin was used as loading control.
