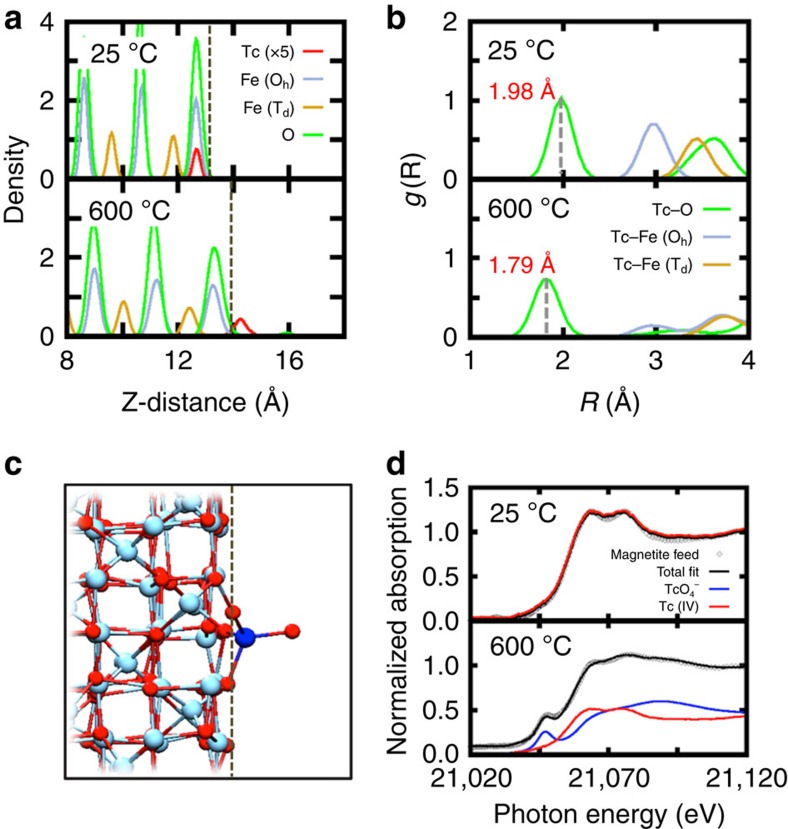
Figure 2. Structural properties and XANES spectra in the presence of Tc.
(a) Atomic-density profile showing atomic arrangement along the z-direction at 25 and 600 °C obtained from AIMD simulations, where dotted vertical line denotes the magnetite surface. (b) Pair distribution function g(R) obtained from AIMD simulation trajectories at 25 and 600 °C. (c) Snapshot of the structure at 600 °C from AIMD trajectories where a blue circle represents Tc, red for O and cyan for Fe. The dotted vertical line denotes the magnetite surface. (d) Normalized XANES spectra at 25 and 600 °C.

