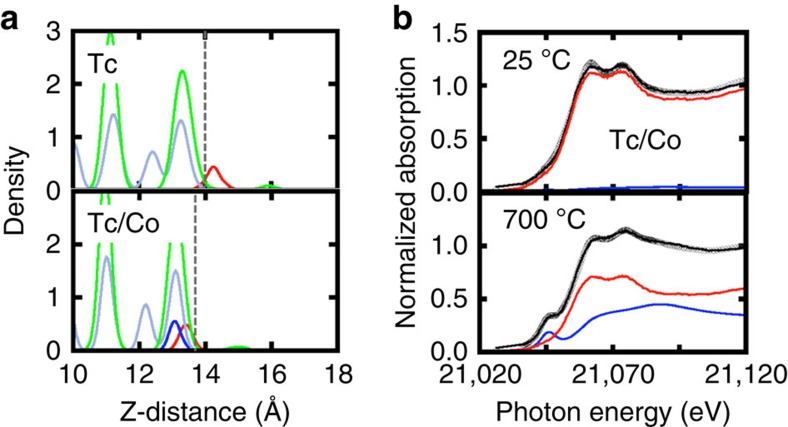
Figure 3. Atomic density and normalized XANES spectra with Co dopant.
(a) Atomic density profiles with and without Co dopant at 600 °C. Red lines represent Tc, blue line for doped atom, grey lines for Fe and green lines for O. (b) Normalized XANES spectra for the Co-doped magnetite at 25 °C as made and treated at 700 °C. Colour codes used are the same as those shown in Fig. 2.

