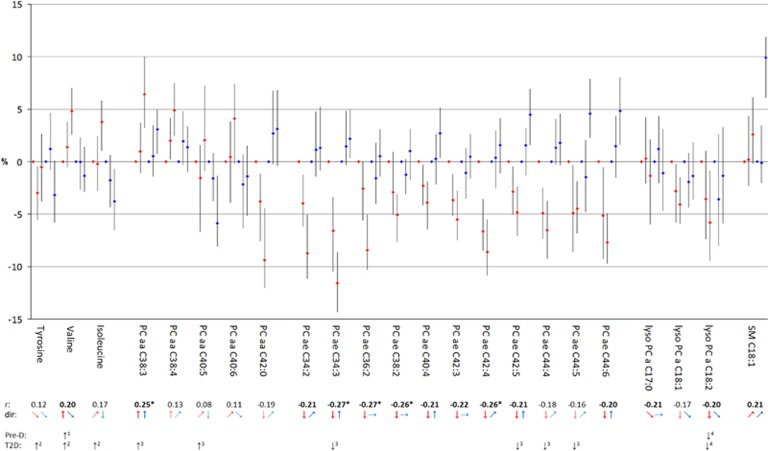
Figure 2.
Median serum concentrations across tertiles of WC (red) and HC (blue) in relation to corresponding reference groups in women. Reference groups are lowest tertiles of WC and HC, respectively. Tertile classifications are as follows: WC tertile 1: WC<74 cm, WC tertile 2: 74 cm ⩽WC<83.5 cm, WC tertile 3:⩾83.5 cm; HC tertile 1: HC<97 cm, HC tertile 2: 97 cm⩽HC<103.5 cm, HC tertile 3: HC⩾103.5 cm. Adjustment sets included the following covariates: body height, age, education, smoking, physical activity, alcohol consumption, fasting status, prevalent hypertension as well as HC for concentrations across tertiles of WC and WC for concentrations across tertiles of HC, respectively. To gain a comprehensive view, correlation coefficients (r) with BMI are added below: r⩾I0.20 I are marked in bold, r⩾I0.25 I are additionally marked by asterisk. Directions (dir) of median serum concentrations across tertiles are presented by arrows: ↑ or ↓= clear trend; ↗ or ↘=tendency;→= marginal tendency. Metabolites already associated with pre-diabetes (Pre-D) and/or type-2-diabetes (T2D) in previous studies are additionally marked: 1=Würtz et al.;45 2=Wang et al.;46 3=Floegel et al.;24 4=Wang-Sattler et al.21 HC, hip circumference; WC, waist circumference.

