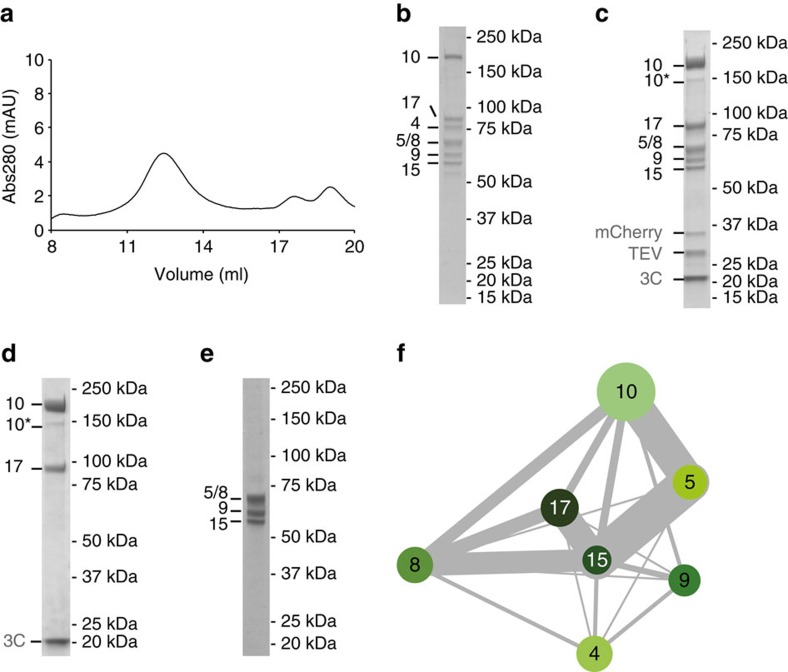
Figure 1. Purification and biochemical characterization of Saccharomyces cerevisiae UtpA.
(a) Size-exclusion chromatogram of endogenous UtpA and (b) corresponding visualization of the main peak fraction by 4–12% SDS-PAGE and Coomassie-blue staining. Co-eluting Utp proteins comprising UtpA (Utp4, Utp5, Utp8, Utp9, Utp10, Utp15, Utp17) are labelled by their respective number on the left. (c,d) SDS-PAGE analysis of UtpA subcomplexes resulting from purifications with buffers of different ionic strengths. Tagged UtpA (Utp10-3C-GFP and Utp15-TEV-mCherry) was purified at 200 mM NaCl on anti-GFP sepharose and incubated with buffers containing either 400 mM NaCl, yielding UtpAΔUtp4 (c), or 800 mM NaCl, yielding the Utp10-Utp17 dimer (d). 10* labels a degradation product of Utp10. TEV and 3C proteases (grey) were used for the elution and the removal of mCherry (grey). (e) SDS-PAGE analysis of the main peak fraction of co-eluting Utp5, Utp8, Utp9 and Utp15 on size-exclusion chromatography. Utp4, Utp5, Utp8, Utp9 and Utp15-TEV-mCherry were overexpressed in yeast and affinity purified. Utp4 dissociated from the complex during size-exclusion chromatography resulting in the elution of the heterotetramer shown. (f) Schematic representation of intersubunit DSS cross-links (grey lines) between UtpA subunits (circles coloured in different shades of green). The thickness of the lines connecting subunits reflects the number of cross-links shared between the subunits.

