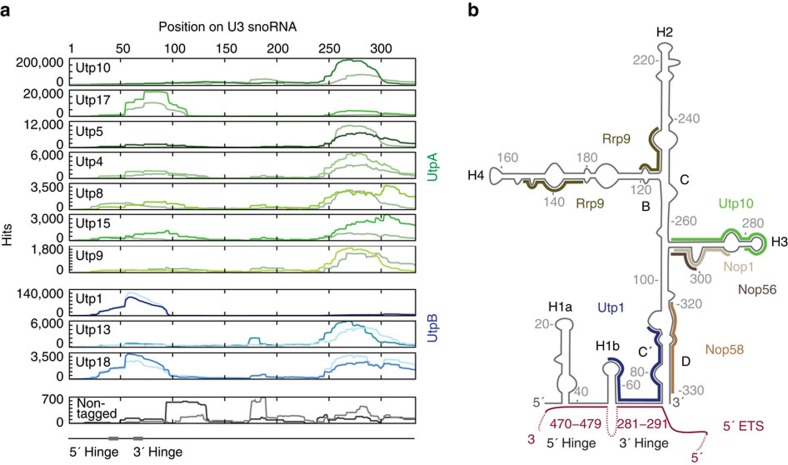
Figure 5. UtpA and UtpB contact the U3 snoRNA.
(a) CRAC library sequences of UtpA (in shades of green, duplicates in light green), UtpB (in shades of blue, duplicates in light blue) and the non-tagged control (in grey, duplicate in light grey) mapped to the spliced SNR17A (encoding the U3 snoRNA) are plotted as frequency of recovery (hits per million mapped reads) at each nucleotide position (indicated above all panels). Individual scales for the frequency of recovery are shown on the left of each subunit panel. Subunit panels are ordered by protein complex and further by their respective number of hits per million mapped reads. The positions of the 3′ and 5′ hinges that base-pair with the 5′ ETS are indicated below the traces. (b) Schematic secondary structure of U3 snoRNA (black) with base-paired 5′ ETS (purple) and CRAC-based binding sites for the U3 snoRNP proteins Rrp9, Nop1, Nop56 and Nop58 in different shades of brown, as determined previously33, binding sites for Utp10 (green) from UtpA and Utp1 (blue) from UtpB. Helices are labelled with H and the conserved Box B/C/C′/D sequence elements are marked with their single letter respectively.

