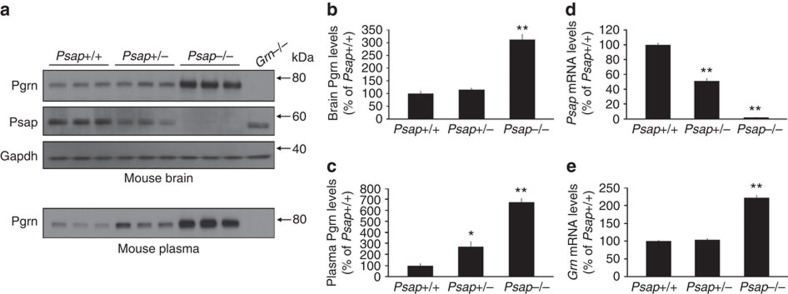
Figure 5. PGRN levels are increased in a mouse model of Psap loss.
(a) Immunoblot of cortical brain homogenates and plasma obtained from Psap+/+, Psap+/− and Psap−/− mice. Grn−/− mouse brain tissue and plasma were used as negative controls. Gapdh immunoreactivity was used to validate equal protein loading. (b,c) Quantification of Pgrn protein levels in the brains (b) and plasma (c) obtained from Psap+/+, Psap+/− and Psap−/− mice (n=3 per group). (d,e) Quantification of Psap (d) and Grn (e) mRNA levels in Psap+/+, Psap+/− and Psap−/− mouse brains (n=3 per group). Values represent the mean±s.e.m. *Differs from Psap+/+ mice, P<0.05; **P<0.0001 by one-way ANOVA.

