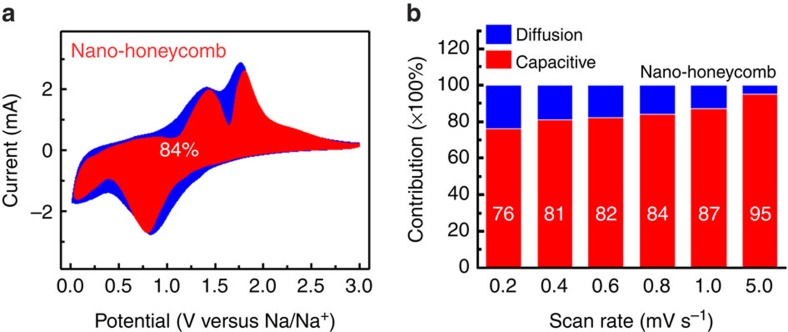
Figure 4. Kinetics and quantitative analysis of the Na+ storage mechanism.
(a) Capacitive (red) and diffusion-controlled (blue) contribution to charge storage of nanohoneycomb at 0.8 mV s−1. (b) Normalized contribution ratio of capacitive (red) and diffusion-controlled (blue) capacities at different scan rate.

