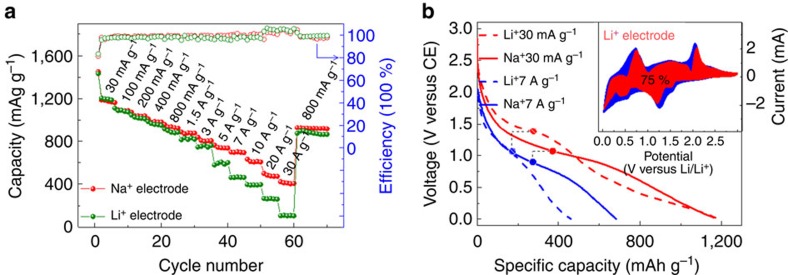
Figure 5. Comparison between Na-ion and Li-ion storage.
(a) Rate performance comparison of the nanohoneycomb electrode at various current densities from 30 to 30,000 mA g−1. (b) Galvanostatic profiles of Na, Li electrodes at rates of 30 mA g−1 and 7 A g−1 after activation. Inset: capacitive (red) and diffusion-controlled (blue) contribution to charge storage at 0.8 mV s−1 during Li uptake. All of the batteries were tested in the same voltage range of 0.01–3 V versus Na/Na+ and Li/Li+ for Na-ion and Li-ion batteries, respectively.

