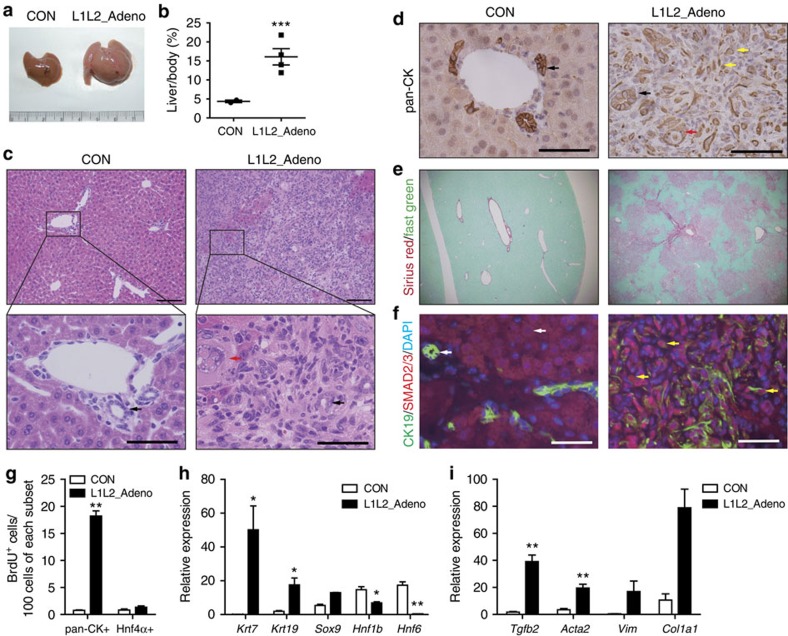
Figure 5. Loss of Lats1/2 in adult livers causes rapid expansion of immature BECs and activation of TGFβ signalling.
(a,b) Photograph (a) shows livers of adeno-Cre (2X10⁸ PFU)-injected control and Lats1−/−; Lats2fl/fl mice (L1L2_Adeno) and dot graph (b) of liver to body weight ratio of adeno-Cre virus injected livers. (c–f) Representative images of haematoxylin and eosin (H&E) (c), anti-pan-CK (d), Sirius red and Fast green (e) and, anti-SMAD2/3 and anti-CK19 (f) staining of control and L1L2_Adeno livers. Black arrows indicate tubular bile ducts and yellow arrows indicate immature BECs. Red arrows indicate LCCs in hepatocytes. Scale bars in (c) up indicate 100 μm and scale bars in (c) bottom indicate 50 μm. Yellow arrows in d indicate pan-CK-positive signal. White arrows in f indicate cytoplasmic SMAD2/3 signal in CK19-positive cells; Yellow arrows in f indicate nuclear SMAD2/3 signals in CK19-positive cells. Scale bars in d and f indicate 50 μm. (g) Bar graph showing quantification of BrdU-positive cells out of 100 pan-CK- and HNF4α-positive cells. (h) Relative mRNA expression levels of BEC-related genes in control and L1L2_Adeno livers. n=4. (i) Relative mRNA expression levels of Tgfβ2 and fibrotic markers in control and L1L2_Adeno livers. The data are presented as means±s.e.m.; n=4, *P<0.05, **P<0.01 and ***P<0.005 (Student's t-test).

