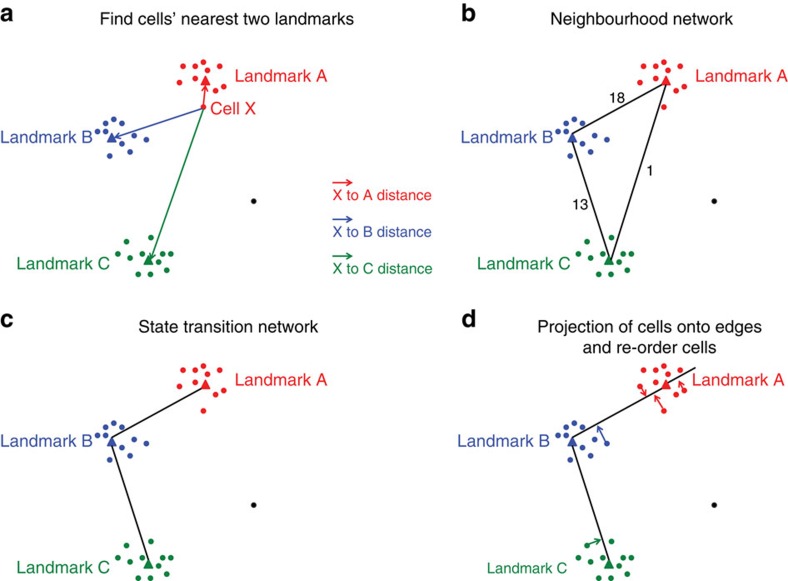
Figure 1. A two-dimensional visual example of Mpath algorithm.
(a) Identify the nearest two landmarks for every cell. (b) Build neighbourhood network to connect the landmarks. Numbers on edges indicate the number of cells for which the two landmarks on both ends of the edge are the nearest neighbouring landmarks. (c) State transition network after trimming edges with lower cell count support. (d) Project individual cells onto the edges and re-order the cells according to the position of projection points.

