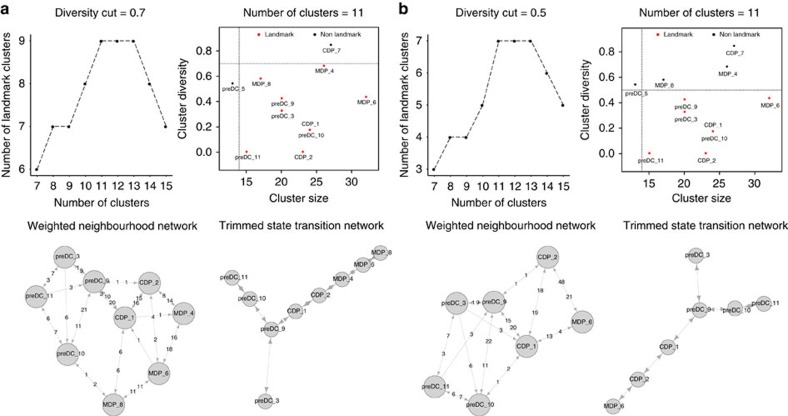
Figure 10. Mpath constructed reproducible cell lineages when the analysis was repeated with different diversity cut for distinguishing landmark clusters from non-landmark clusters.
We evaluated the robustness of Mpath by repeating the analysis of the DC progenitor data set using different diversity cut for distinguishing landmark clusters. (a) Mpath results when diversity cut is 0.7. (b) Mpath results when diversity cut is 0.5.

