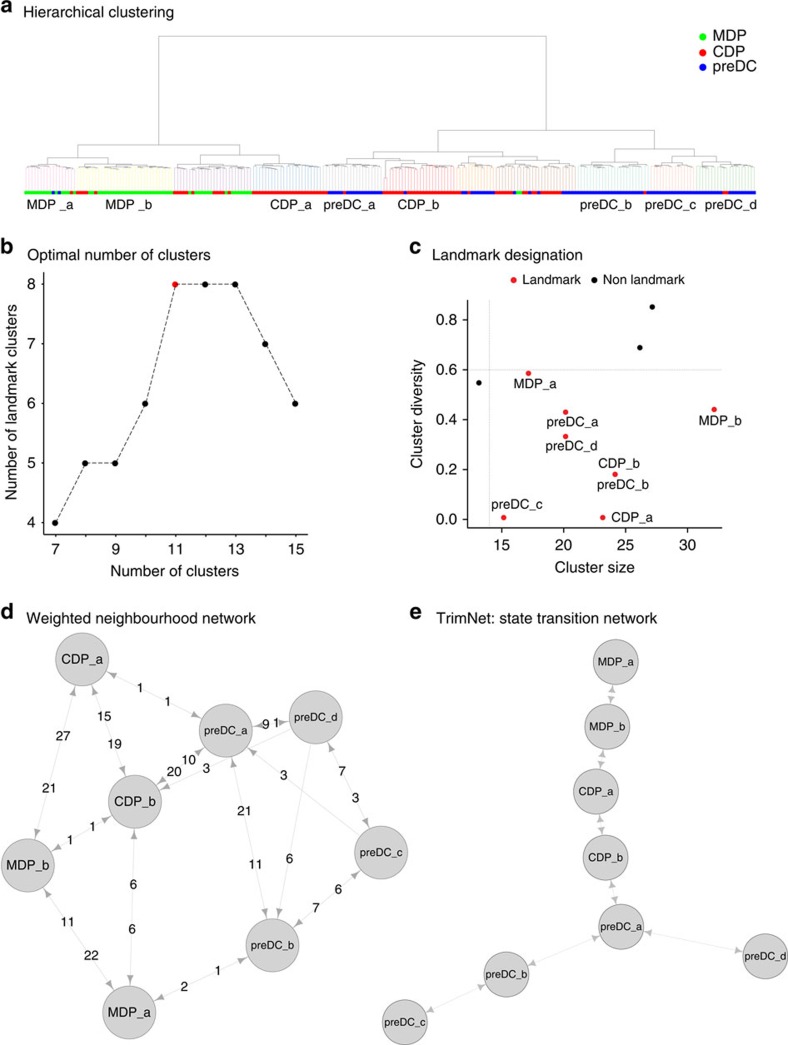
Figure 2. Mpath constructed multi-branching dendritic cell (DC) lineages.
Mpath was applied to single-cell RNA-sequencing data of mouse bone marrow-derived MDP, CDP and preDC cells. (a) Hierarchical clustering of cells using Euclidean distance and Ward.D agglomeration method. The clusters were defined by cutting the dendrogram into 11 branches. Clusters comprising cells mainly from one population were named by the major cell type of the respective clusters. (b) Determine the optimal number of clusters by examining the plot of landmark numbers versus total number of clusters. (c) Clusters that passed both size and purity cutoff were assigned as landmark clusters. (d) Weighted neighbourhood network of landmarks. Nodes represent landmarks; edges represent putative transitions between landmark states; numbers on edges represent edge weights measured by number of cells that were located in the neighbourhood between the landmarks. (e) State transition network after trimming low-weighted edges in the weighted neighbourhood network.

