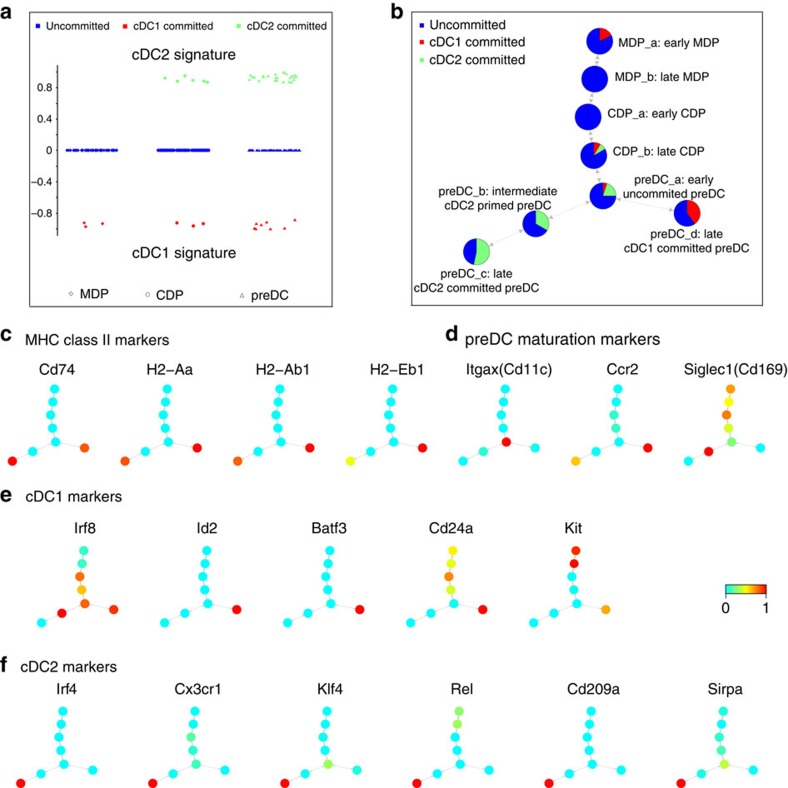
Figure 3. Mpath-derived dendritic cell lineages confirm early DC subset commitment.
We annotated each landmark state by cMAP analysis and examining progression of DEGs. (a) cMAP analysis of single cells using mature cDC2 versus cDC1 signature genes. Y axis represents cMAP scores of individual cells; positive cMAP scores indicate enrichment of cDC2 signature; negative cMAP scores indicate enrichment of cDC1 signature; zero cMAP score indicates null enrichment. (b) Proportion of cDC1-committed, cDC2-committed and uncommitted cells at each landmark state of the state transition network. Uncommitted, cDC1-committed and cDC2-committed cells were defined by cMAP analysis as shown in a. (c) Overlay of MHC class II marker expression on the state transition network. (d) Overlay of preDC maturation marker expression on the state transition network. (e) Overlay of cDC1 marker expression on the state transition network. (f) Overlay of cDC2 marker expression on the state transition network. In (c–f), the nodes are colour-coded by TPM values scaled to range [0, 1].

