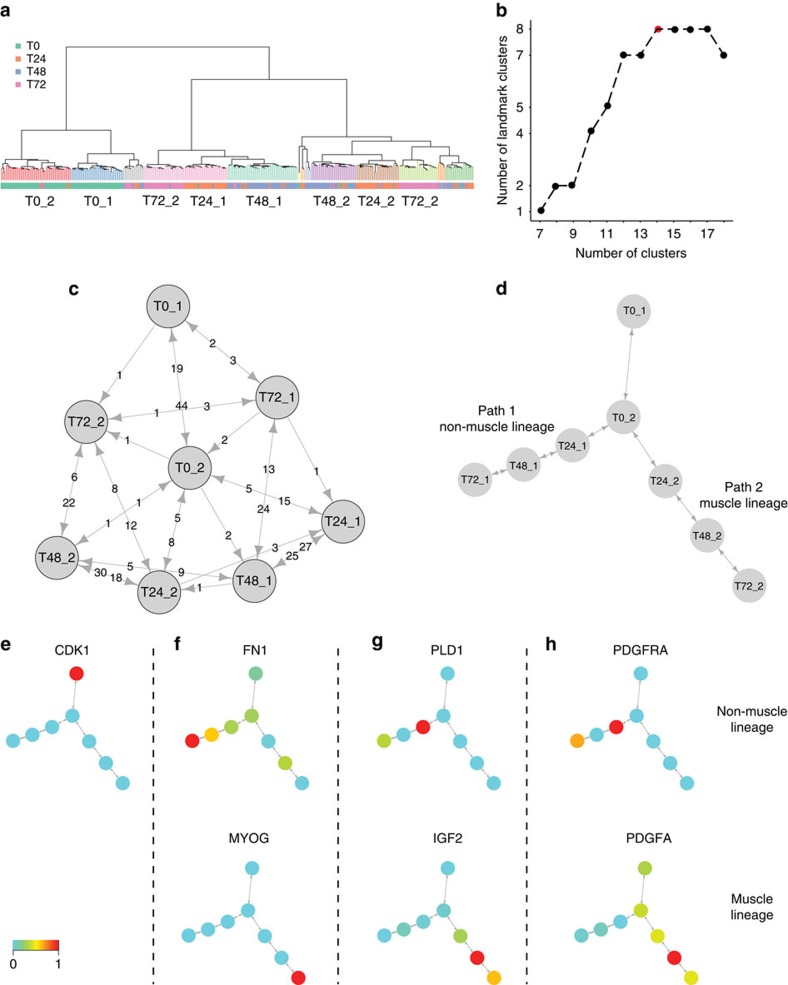
Figure 6. Mpath constructed multi-branching cell lineages of myoblast differentiation.
Mpath was applied to single-cell RNA-sequencing data of primary human myoblasts. (a) Hierarchical clustering of cells and landmark designation. (b) Determine the optimal number of clusters by examining the plot of landmark numbers versus total number of clusters. (c) Weighted neighbourhood network of landmarks. (d) State transition network after trimming low-weighted edges. (e) Overlay of cell cycle marker expression on the state transition network. (f–h) Expression progression of pairs of genes for which gene–gene interactions were reported to play a role in myogenesis suggested cell–cell crosstalk between the two branches during myoblast differentiation.

