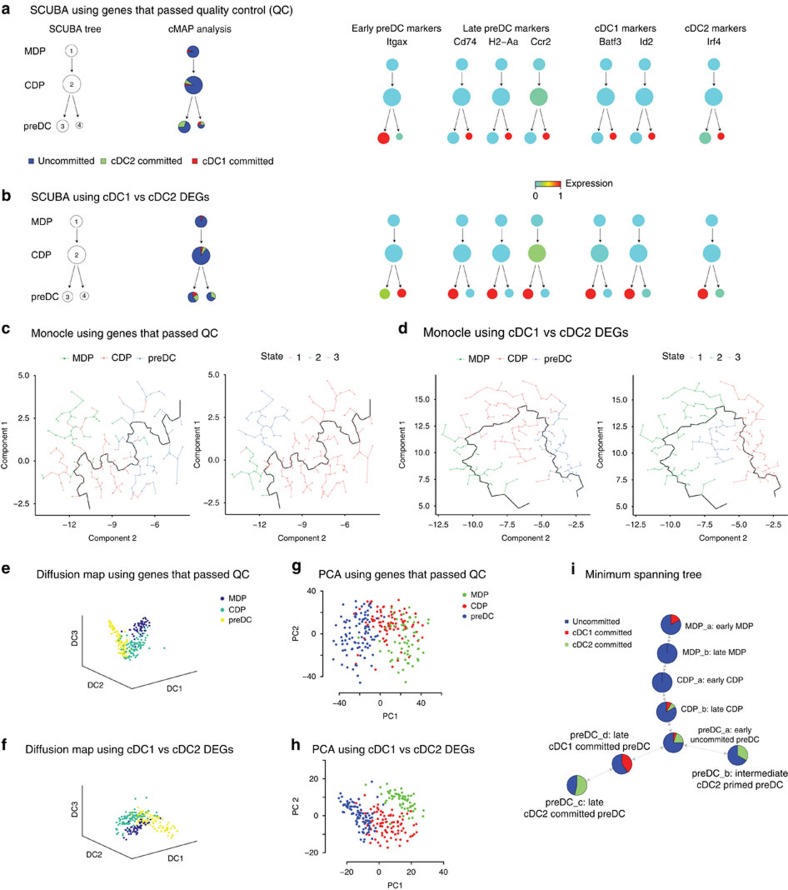
Figure 8. Comparing Mpath with existing methods.
SCUBA, monocle, diffusion map, PCA and MST were applied to our single-cell RNA-sequencing data set of DC progenitors. (a–b) Bifurcation trees generated by SCUBA using all genes that passed quality control (QC) and DEGs between mature cDC1 and cDC2 respectively; the pie's represent proportion of cells that were uncommitted, cDC1-committed or cDC2-committed as identified via cMAP analysis; the panel on the right shows overlay of early preDC, late preDC, cDC1 and cDC2 marker expression on the SCUBA trees. (c,d) Monocle analysis using all genes that passed QC and DEGs between mature cDC1 and cDC2 respectively. (e–f) Diffusion map analysis using all genes that passed QC and DEGs between mature cDC1 and cDC2 respectively. (g,h) PCA using all genes that passed QC and DEGs between mature cDC1 and cDC2 respectively. (i) MST-derived state transition network using Euclidean distances between the averages of cells in each landmark cluster.

