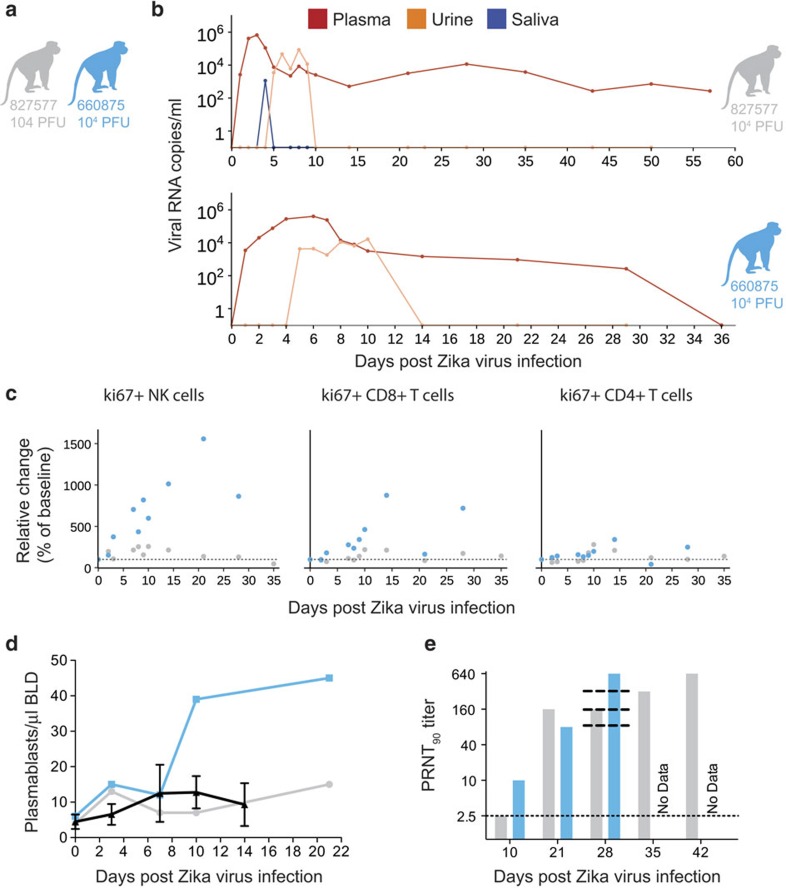
Figure 4. Characterization of Zika virus infection in animals infected during the first trimester of pregnancy.
(a) Schematic of animals presented in this figure as cohort 3. Dots, lines and bars representing each animal match in colour throughout the figure. (b) vRNA copies of the plasma, urine and saliva from each pregnant animal. Oral swabs could not be obtained from 660875. (c) Absolute numbers of Ki-67+ NK, CD8+ T-cell and CD4+ T-cell populations presented as a percentage relative to baseline (× 100) over time in each animal. (d) Plasmablast expansion over time from each pregnant animal. The average plasmablast expansion of cohorts 1 and 2 animals infected with the 104 p.f.u. is presented by the black line. Error bars represent s.d. (e) PRNT90 titres over time for each animal. Lines representing the titres from cohort 2 animals are overlaid at 28 d.p.i. for reference (top to bottom: 610107, 181856 and 411359).

