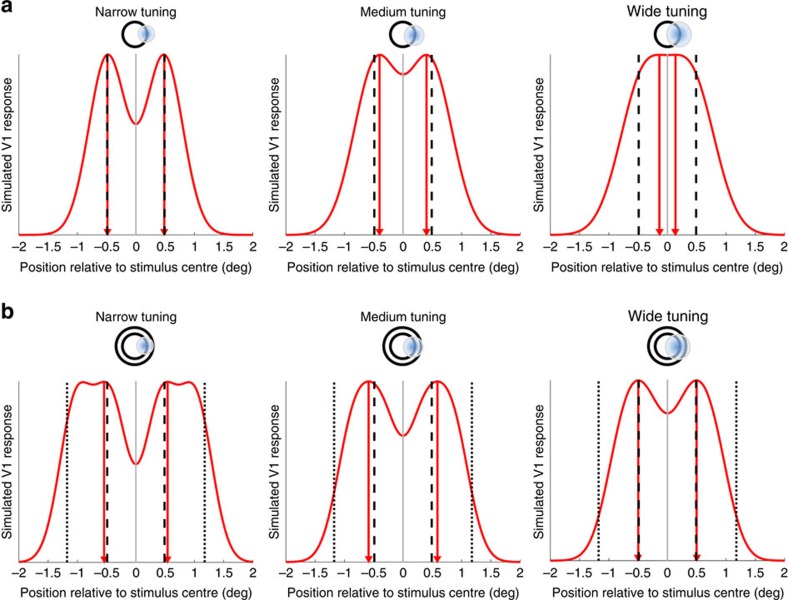
Figure 3. Basic read-out model.
(a,b). Simulated activity profiles for isolated circle (a) and Delboeuf stimuli (b) were generated by passing the actual location of the stimulus edges through a bank of Gaussian filtres covering the stimulus locations. The red curves indicate the output of the filter bank as a simulation of stimulus-related population activity in V1. The separation between the two peaks is an estimate of stimulus size (red triangles and vertical red lines). The vertical black lines denote the actual position of the edges of the target stimulus (dashed) and the inducer annulus in the Delboeuf stimuli (dotted). Simulated neuronal tuning width increases from left to right (see also the schematic diagram above each graph representing the stimulus and an example receptive field).

