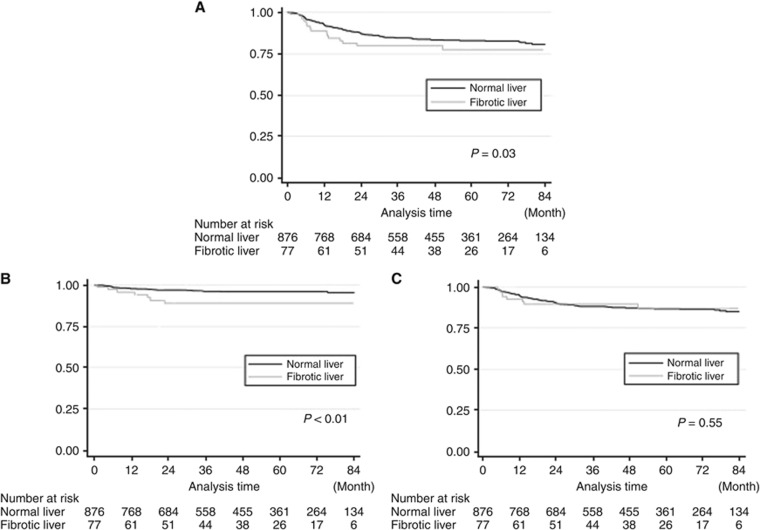
Figure 2.
Kaplan–Meier curve of RFS between the FL and NL groups by the site of recurrence.(A) Recurrence-free survival curve. (B) Hepatic metastasis-free survival curve. (C) Extrahepatic metastasis-free survival curve. (A) Patients in the FL group had a significantly worse survival rate (log-rank P=0.03). (B) In hepatic metastasis, the 5-year RFS rate in the FL group was significantly poorer than that in the NL group (FL 89.1% vs NL 96.0%, log-rank P<0.01). (C) Patients in the FL group had a worse 5-year extrahepatic RFS rate (5-year hepatic RFS rate; FL 87.1% 95% CI 75.4–93.5 vs NL 86.5% 95% CI 83.8–88.7), but the difference did not reach statistical significance (log-rank P=0.55).

