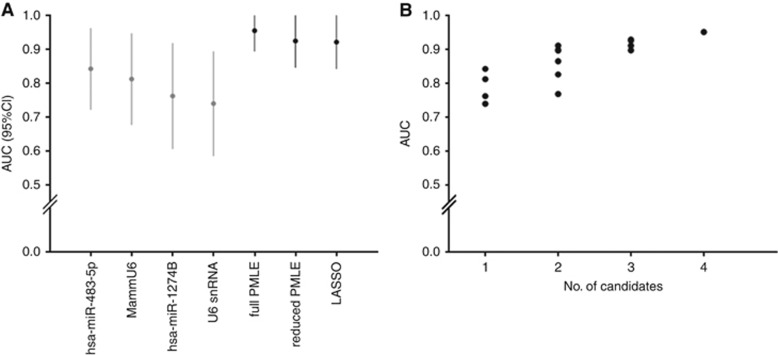
Figure 3.
AUC values for the candidate biomarkers. (A) In gray are reported the AUC (95% CI) of the univariate analysis; in black those of the penalised regression models (full PMLE, reduced PMLE, LASSO). (B) AUC values corresponding to the all-subsets analysis including those from univariate analysis.

