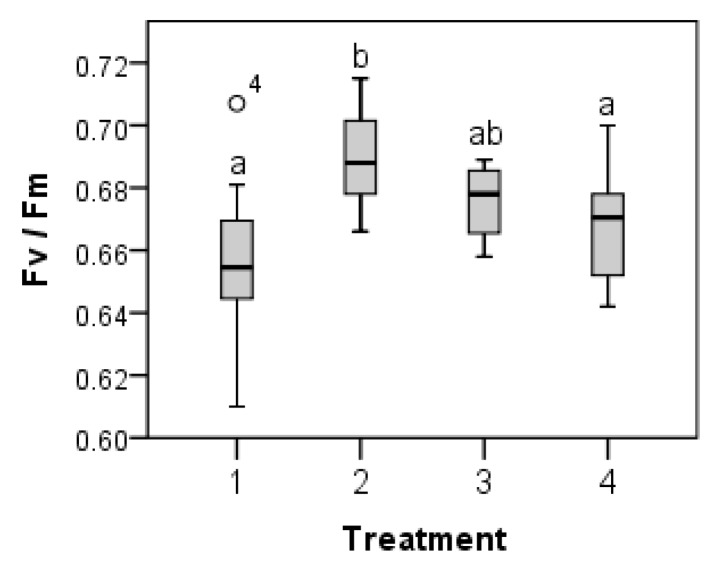
Figure 2.
Box plots of Fv/Fm in P. schreberi from 12 different sites, in response to short-term (13 days) temperature treatment ex situ. Different letters indicate significant difference (determined by Fisher’s PLSD post-hoc test). Treatments in day/night temperatures: 1 = 10/5 °C; 2 = 20/10 °C; 3 = 25/15 °C; 4 = 30/20 °C. The median in the box plot is indicated by the horizontal line in the box, the box indicates the 25th and 75th percentiles and the bars indicate the 10th and 90th percentiles. n = 12 (sites). Site effects were non-significant (Table 2).

