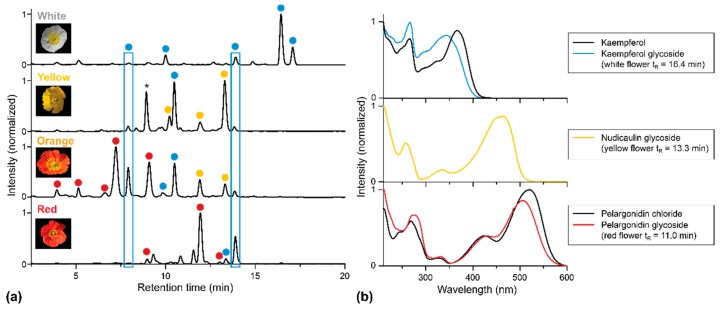
Figure 3.
HPLC-PDA analysis of extracts of apical petal parts of four P. nudicaule cultivars. (a) Chromatograms recorded at 254 nm. Peaks representing the same aglycone (previously identified by LC-MS and NMR [7,10,15] and here classified by the corresponding UV/Vis absorption spectra) are marked with the same color: Kaempferol glycoside, nudicaulin, pelargonidin glycoside. The peak marked with an asterisk (yellow flower, tR = 8 min) shows no flavonoid absorption spectrum and may be a degradation product. (b) UV/Vis absorption spectra of representative glycosides and authentic aglycones of kaempferol and pelargonidin. Deviations between UV/Vis absorption spectra of the references (kaempferol, pelargonidin chloride), and the glycosides are an effect of the substitution. Nudicaulin aglycone is not available due to instability. The obtained nudicaulin UV/Vis absorption spectrum matches the one reported by Tatsis et al. [15].

