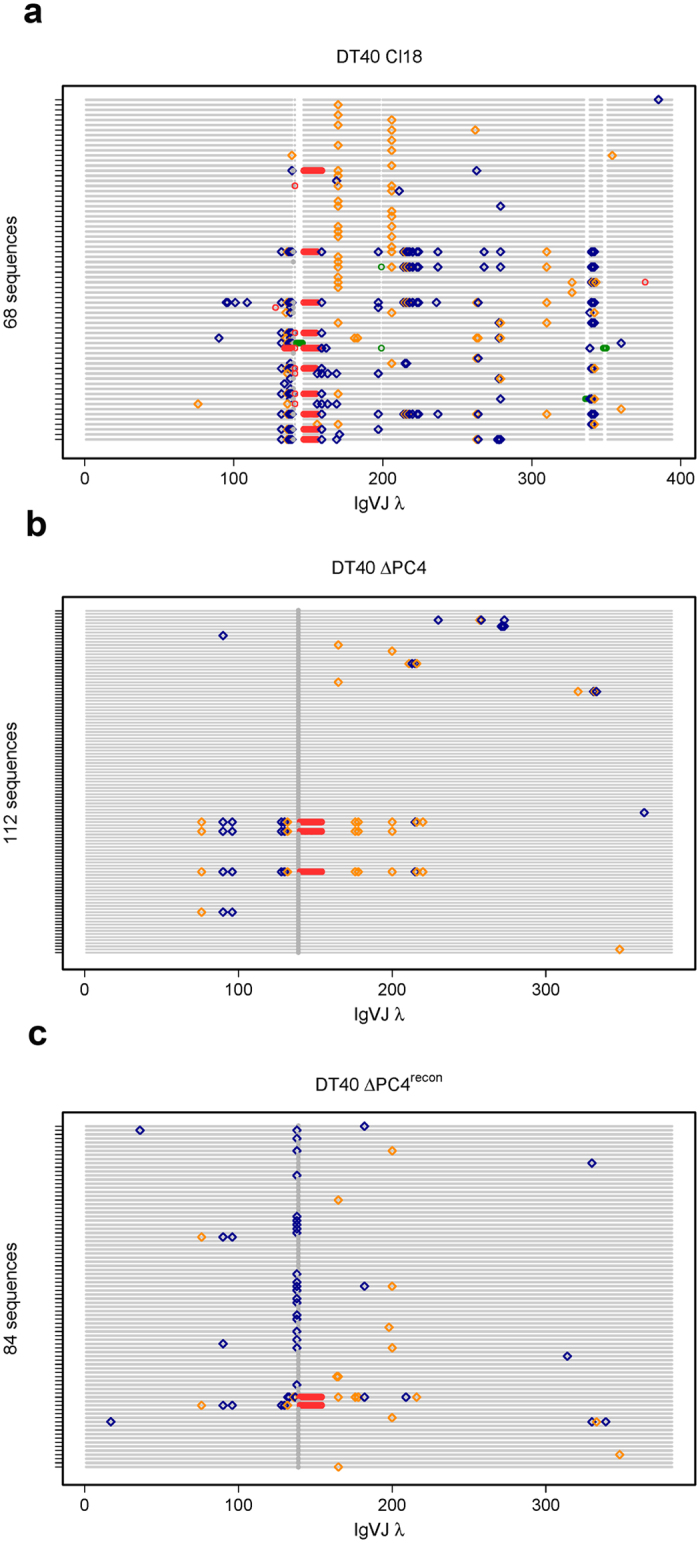
Figure 3. Quick-view mutational analysis reveals PC4’s influence on GC.

Quick-view analysis of GC-active bulk population sequences. Cells were sorted for IgM (−) in the DT40 Cl18 (a) and DT40 ΔPC4 (b) clones and for IgM (−)/GFP (+) in the DT40 ΔPC4recon (c) clone. Following 2 weeks bulk growth (~25 generations) of the sorted population, gDNA was recovered from each and the rearranged Igλ VJ segments were sequenced. The Quick-view graphical representation that we use clearly identifies insertions and deletions (green and red circles respectively), transitions and transversions (blue and gold diamonds respectively), and highlights the “+1 G” (grey circle) creating the frameshift.
