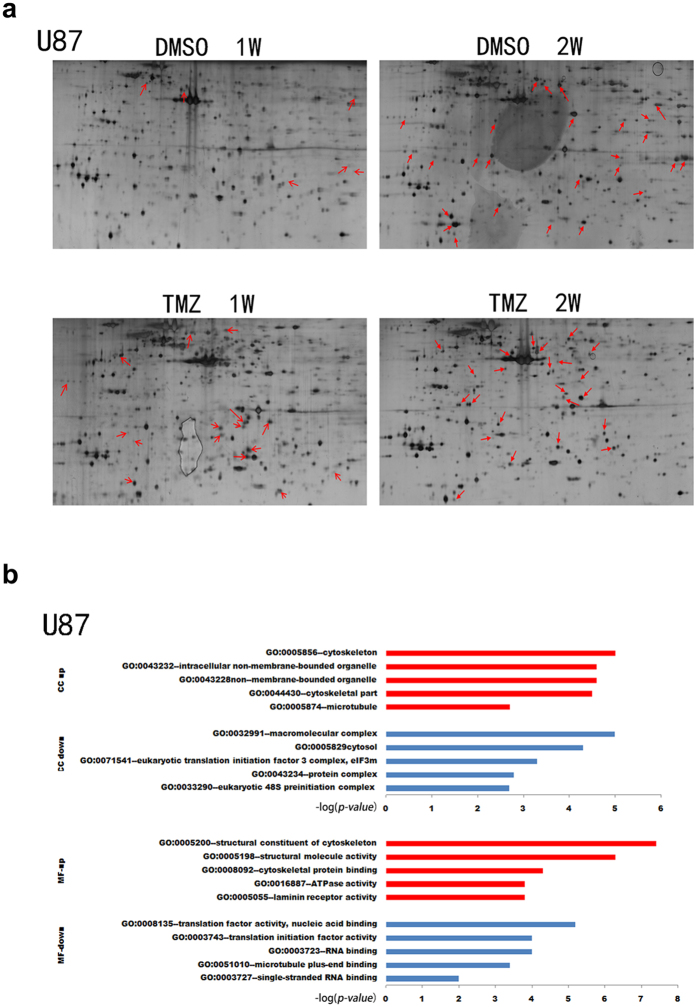
Figure 2. Identification of differentially expressed proteins after TMZ treatment of GBM cells.
(a) The 2-DE data of U87 cells after treated with temozolomide for a week or two. Differentially expressed protein spots were noted with red arrows. (b) Gene ontology analysis with Enrichment analysis (beta) (http://geneontology.org/). Upper, the top 5 dysregulated cellular component (CC) ranked according to –log (p-value), P < 0.05. Lower, the top 5 dysregulated molecular functions (MF) ranked according to –log (p-value), P < 0.05.

