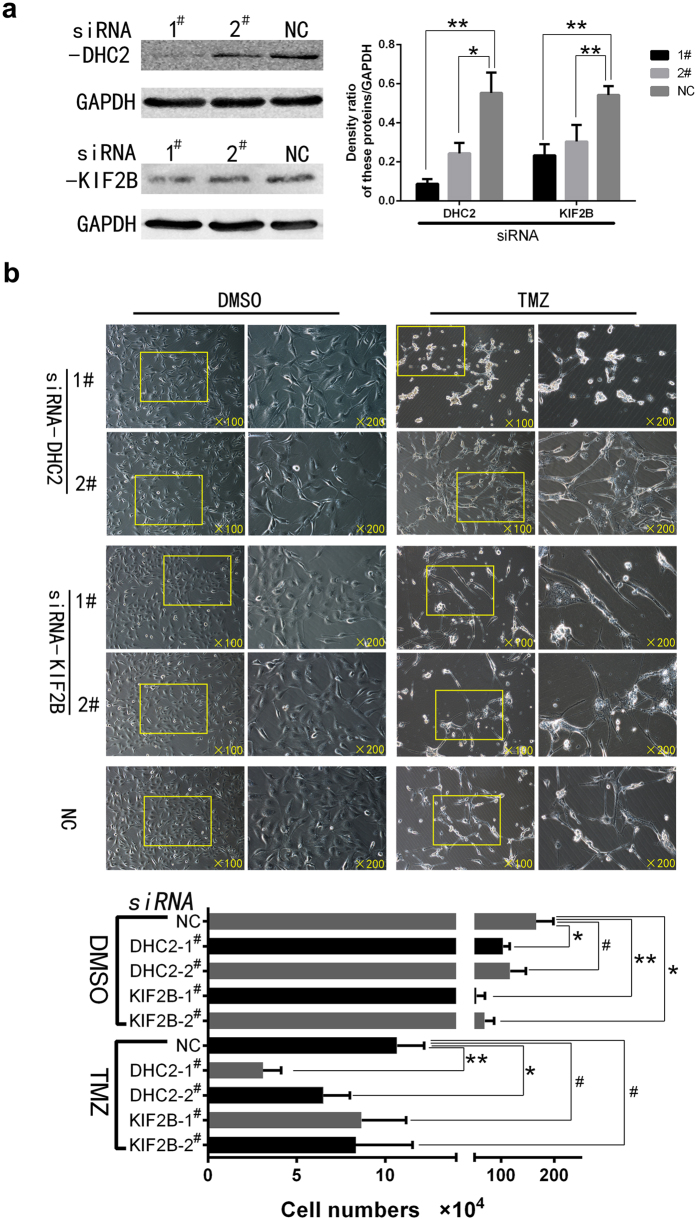
Figure 6. Knockdown of DHC2 and KIF2B expression in U87 cells.
(a) Western blot. Cells were grown and transfected with two different siRNAs for 8 h and cultured for 48 h and then subjected to Western blot analysis for protein expression. The graph is summarized data of the blot. *P < 0.05 and **P < 0.01. (b) Morphology and viability change of cells after knockdown of DHC2 and KIF2B expression followed by temozolomide treatment for one week. Cells were then counted and the graph shows the number of surviving cells in different groups (#P > 0.05; *P < 0.05 and **P < 0.01).

