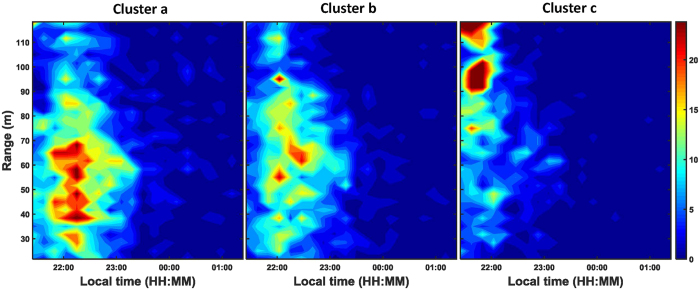
Figure 5. Heatmaps showing cluster a (above), b (middle) and c (bottom) related to the time and spatial range of the insect records.
Note the different count scale bars and colour codes, in particular for cluster c. The dotted red line shows the wing beat frequency cut-off used for Fig. 3.

