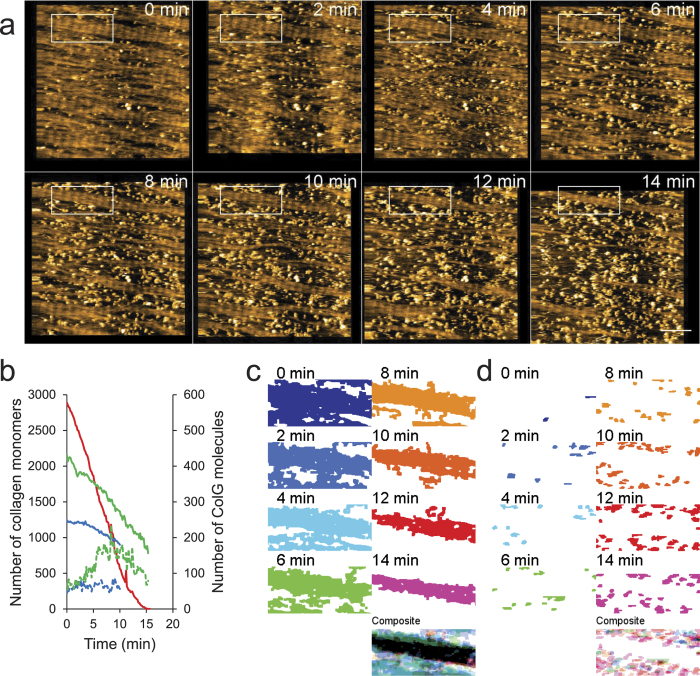
Figure 2. HS-AFM imaging of collagen fibril degradation by ColG.
(a) Representative HS-AFM image sequence of collagen fibril degradation by 6 μg/mL ColG. These images are taken from Supplementary Movie 2. Scanning rate, 10 s/frame; Scan area, 1000 × 1000 nm2 with 500 × 500 pixels; Bar, 200 nm; Z-scale, 5 nm. (b) Number of remaining collagen molecules (solid lines) and number of collagenase molecules (dashed lines) at the edge of the collagen microribbon over time. Different colors correspond to individual experiments (1.5 μg/mL (blue), 6 μg/mL (red and green) ColG). (c,d) Binary image sequence and a composite image of the collagen-covered area (c) and ColG molecules (d) in the region highlighted in (a) show that microribbon is gradually degraded by ColG from the edge of the microribbon and that ColG molecules engage at the edge of the microribbon.

