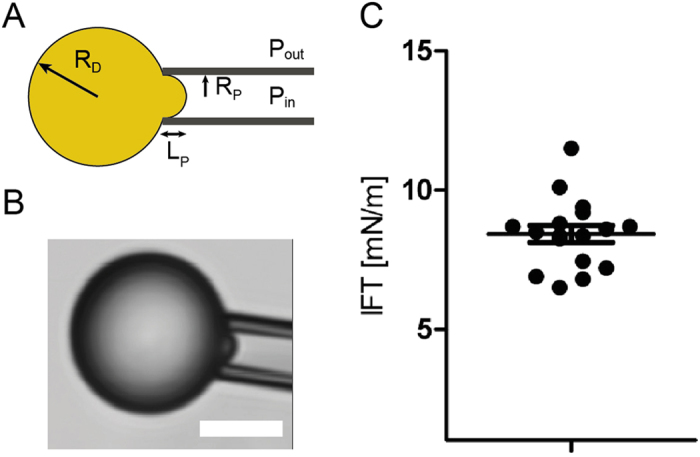
Figure 5.

(A) Schematic view of the micropipette experiment used to measure the interfacial tension of the droplets. RP and RD are respectively the pipette and the droplet radius. (B) Bright field microscopy image of the droplets aspirated by the micropipette. Scale bar: 5 μm. (C) Plot showing the interfacial tension (IFT) of soybean oil droplets, dots are independent droplets (N = 17). Mean interfacial tension is 8.3 ± 1.26 mN.m−1.
