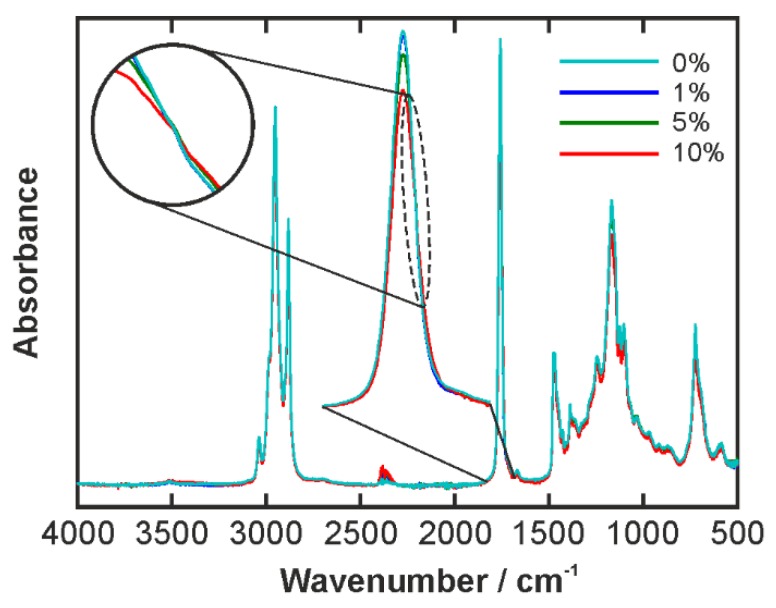
Figure 6.
IR spectra of the oil phases containing different amounts of emulsifier. The percentages in the legend are wt % PGPR. The zoomed in region shows the C=O stretching peak. The small peak around 2300 cm−1 is an experimental artifact of the diamond crystal involved in the ATR measurement. The zoomed in region in the circle shows the isosbestic point at 1735 cm−1.

