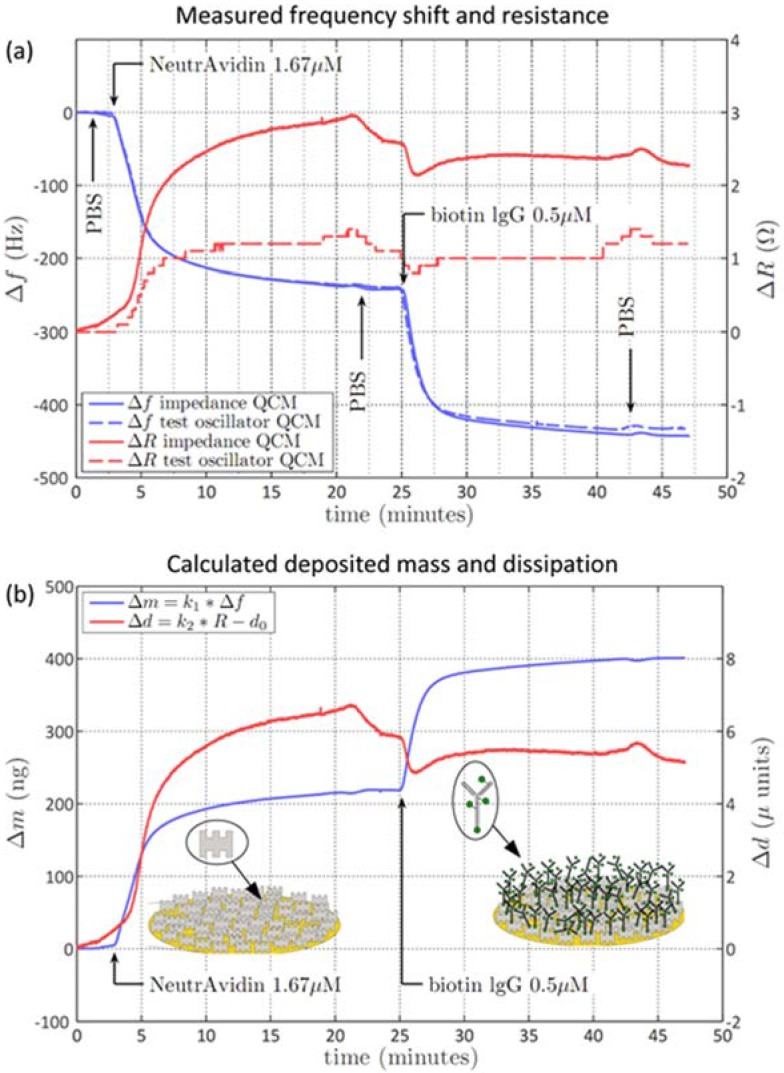
Figure 2.
Impedance QCM measurement results of a simple bio-chemical test reaction. (a) The impedance QCM raw data (solid blue and red lines) is compared to the test oscillator QCM (dashed lines) (both with 9.995 MHz quartz crystals). Blue traces show frequency changes (Hz, left axis), and red traces show resistance changes (Ohm, right axis). After washing the liquid chamber with PBS (phosphate-buffered solution) the first step in this reaction is the adsorption of NeutrAvidin on gold (240 Hz shift) followed by the specific binding of biotin labeled antibodies (IgG, immunoglobulin G; 195 Hz shift); (b) based on the raw data the mass adsorption (ng; left axis) and the change in dissipation (micro-units; right axis) are calculated. The mass adsorption is inversely proportional to the frequency shift (k1), while the dissipation is proportional (k2) to the resistance. The sketches show the adsorption of avidin to the gold surface and the subsequent specific binding of biotin-IgG to the avidin layer.

