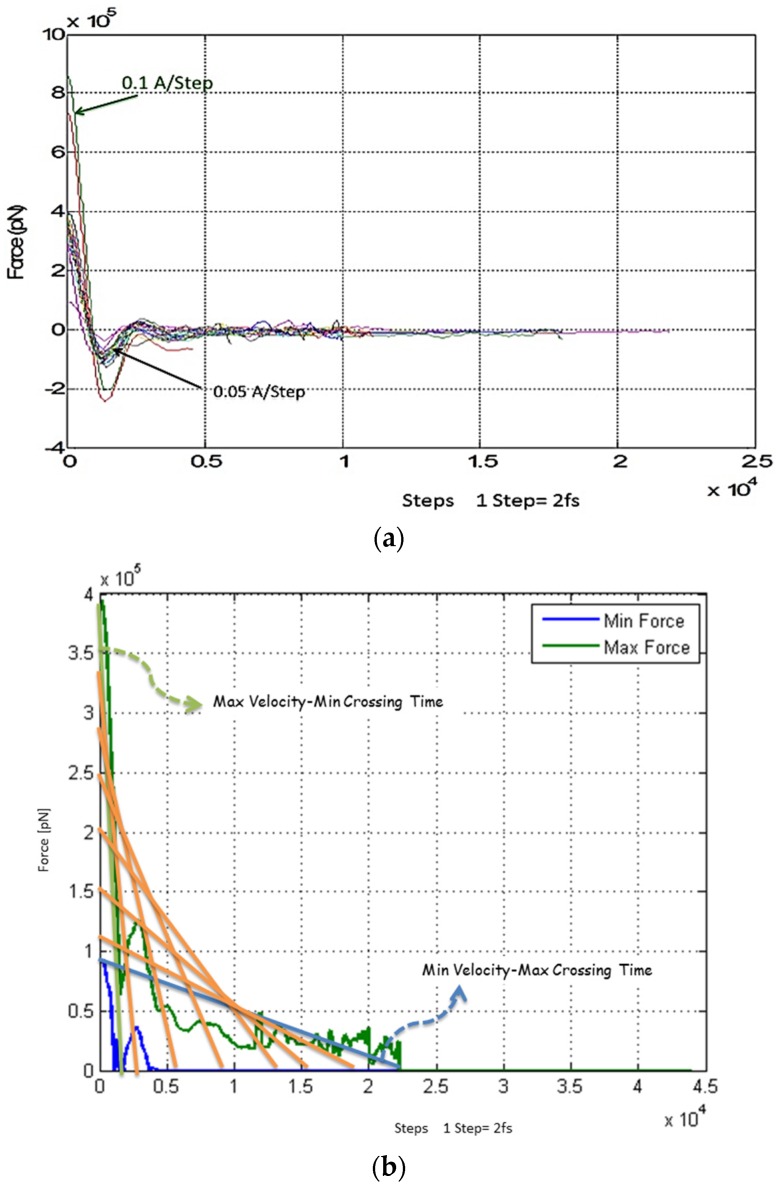
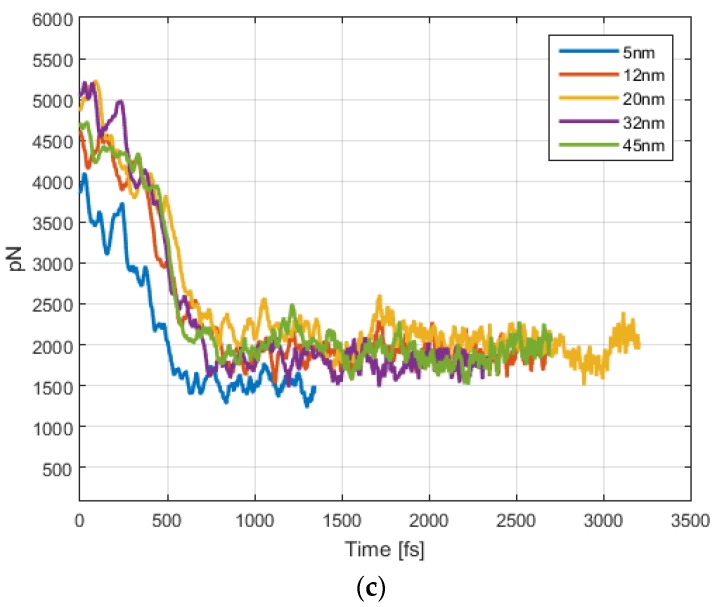
Figure 5.
(a) Force Profile. Colored lines are related to different velocities of NPs. In this figure, the force profile needed for crossing nanoparticles is illustrated; (b) Diagram of minimum and maximum forces which are needed for crossing the BBB. Colored lines are related to different velocities of NPs; (c) Magnetic force versus time for different sizes of NPs ranging from 5 to 45 nm.


