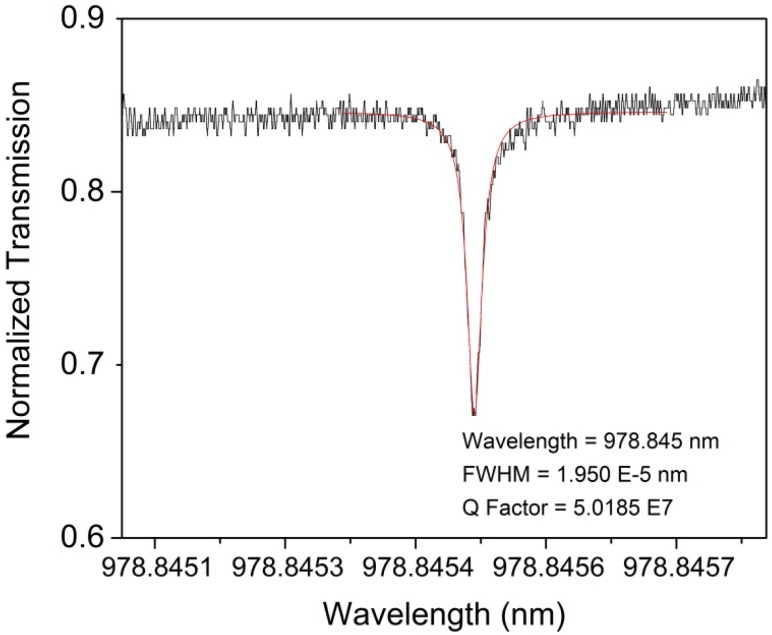
Figure 5.
Q factor results of Dish 9 Sphere 1 (uncoated). Q Factors for the Dish 9 Spheres yielding consistent and high results above 106 Q-factor measurements. The figure depicts a peak with the Lorentzian fit (red line) used to determine the center wavelength and full-width at half-maximum of the peak.

