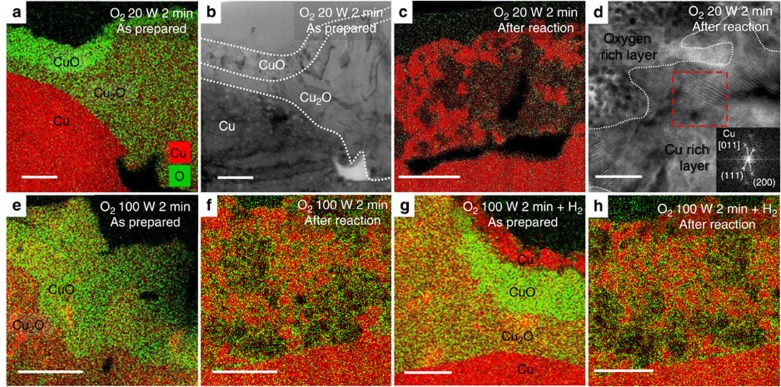
Figure 2. Morphological and chemical analysis of plasma-activated Cu foils.
EDS elemental maps of Cu foils treated with O2 plasma for (a–d) 20 W 2 min; (e–f) 100 W 2 min; and (g–h) 100 W 2 min+H2 plasma. The images labelled ‘after reaction' were used as catalyst for CO2RR for 1 h at −0.91 V versus RHE. (b,d) HRTEM and SAED analysis of the O2 plasma 20 W 2 min treated sample before and after the reaction, respectively. Scale bars, (a–c) 300 nm; (d) 20 nm; (e–h) 200 nm.

