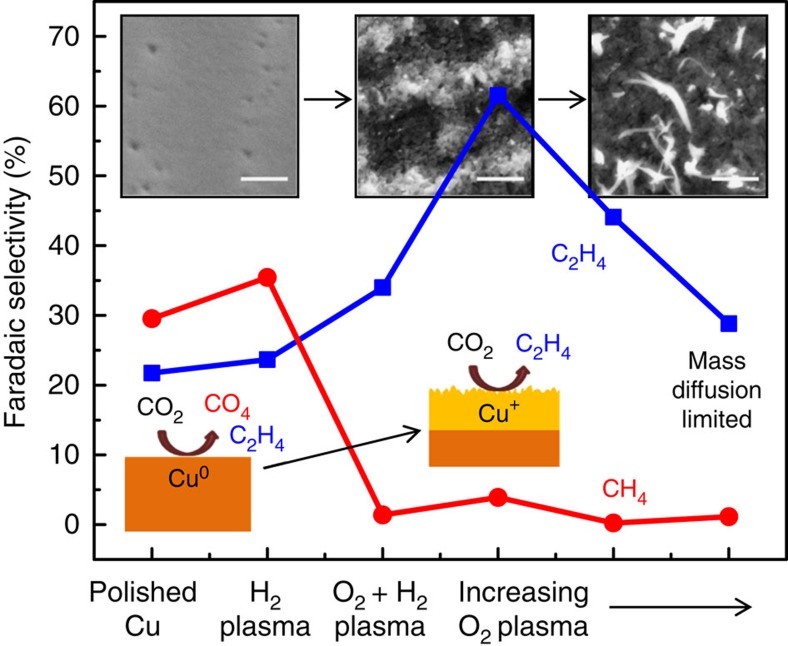
Figure 6. Summary of hydrocarbon selectivity of plasma-treated Cu foils.
From left to right, the insets show SEM images of the low surface area H2 plasma-treated metallic Cu foil, the O2 20 W 2 min plasma-treated Cu foil with optimal ethylene selectivity, and the high surface area nanoneedles on the O2 100 W 10 min oxidized sample after the reaction (500 nm scale bars).

