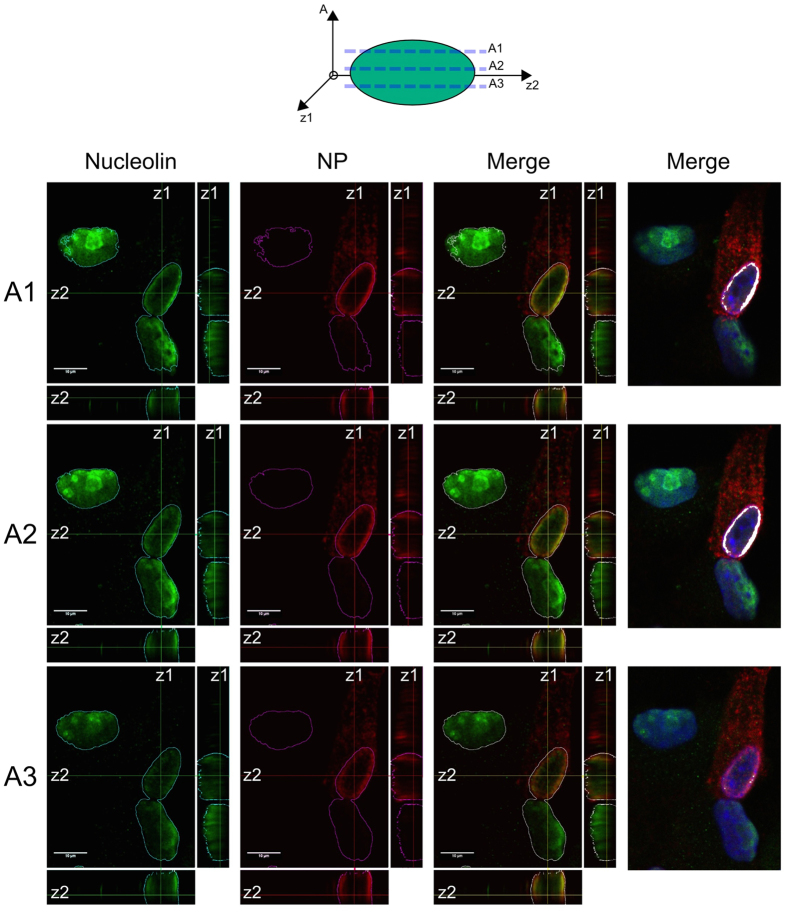
Figure 2. Influenza virus induces a nuclear polarized redistribution of nucleolin.
A549 cells were infected with H3N2 (MOI 1) and fixed at 8 hpi. Immunofluorescence staining of NP (red) and nucleolin (green) were performed. Single optical sections through the top (A1), the midline (A2) and the bottom (A3) of nuclei (xy) and z-axis reconstruction (z1 and z2, respectively) are represented. Merged fluorescent signals are presented, as indicated. Scale bar = 10 μM. JAcoP plugin for imageJ was used to highlight the colocalization of the two stainings by thresholding the signal above the background80. For easier visualization, colocalized pixels are colorized in white (right panels).

